Dashboard Monitoring#
Dashboard Monitoring is a comprehensive feature that empowers users to effectively monitor all created and available dashboards. This feature specifically enables the monitoring of scheduled dashboards generated using the schedule dashboard functionality. It provides valuable visibility into dashboard operations.
To watch the video, click on Dashboard Monitoring.
Accessing Dashboard Monitoring#
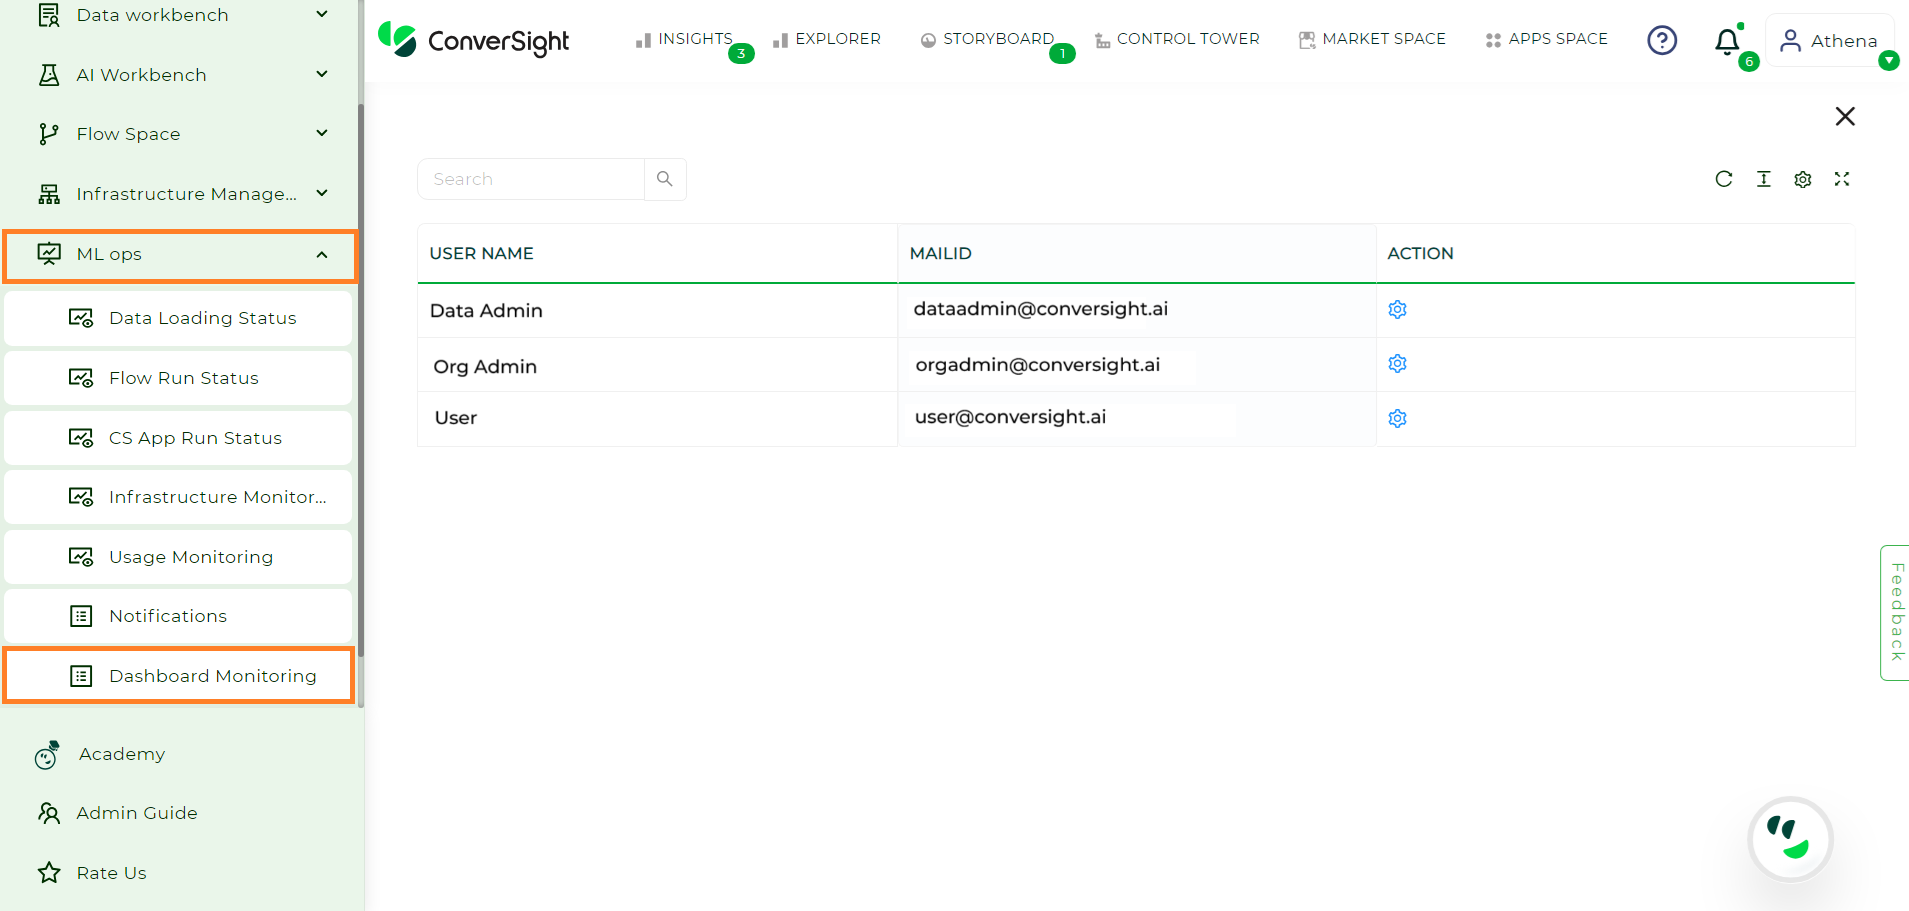
In order to utilize the Dashboard Monitoring capability within the ConverSight Platform, navigate to the configuration sidebar and select the option labeled Dashboard Monitoring under the ML Ops section.
Accessing Dashboard Monitoring#
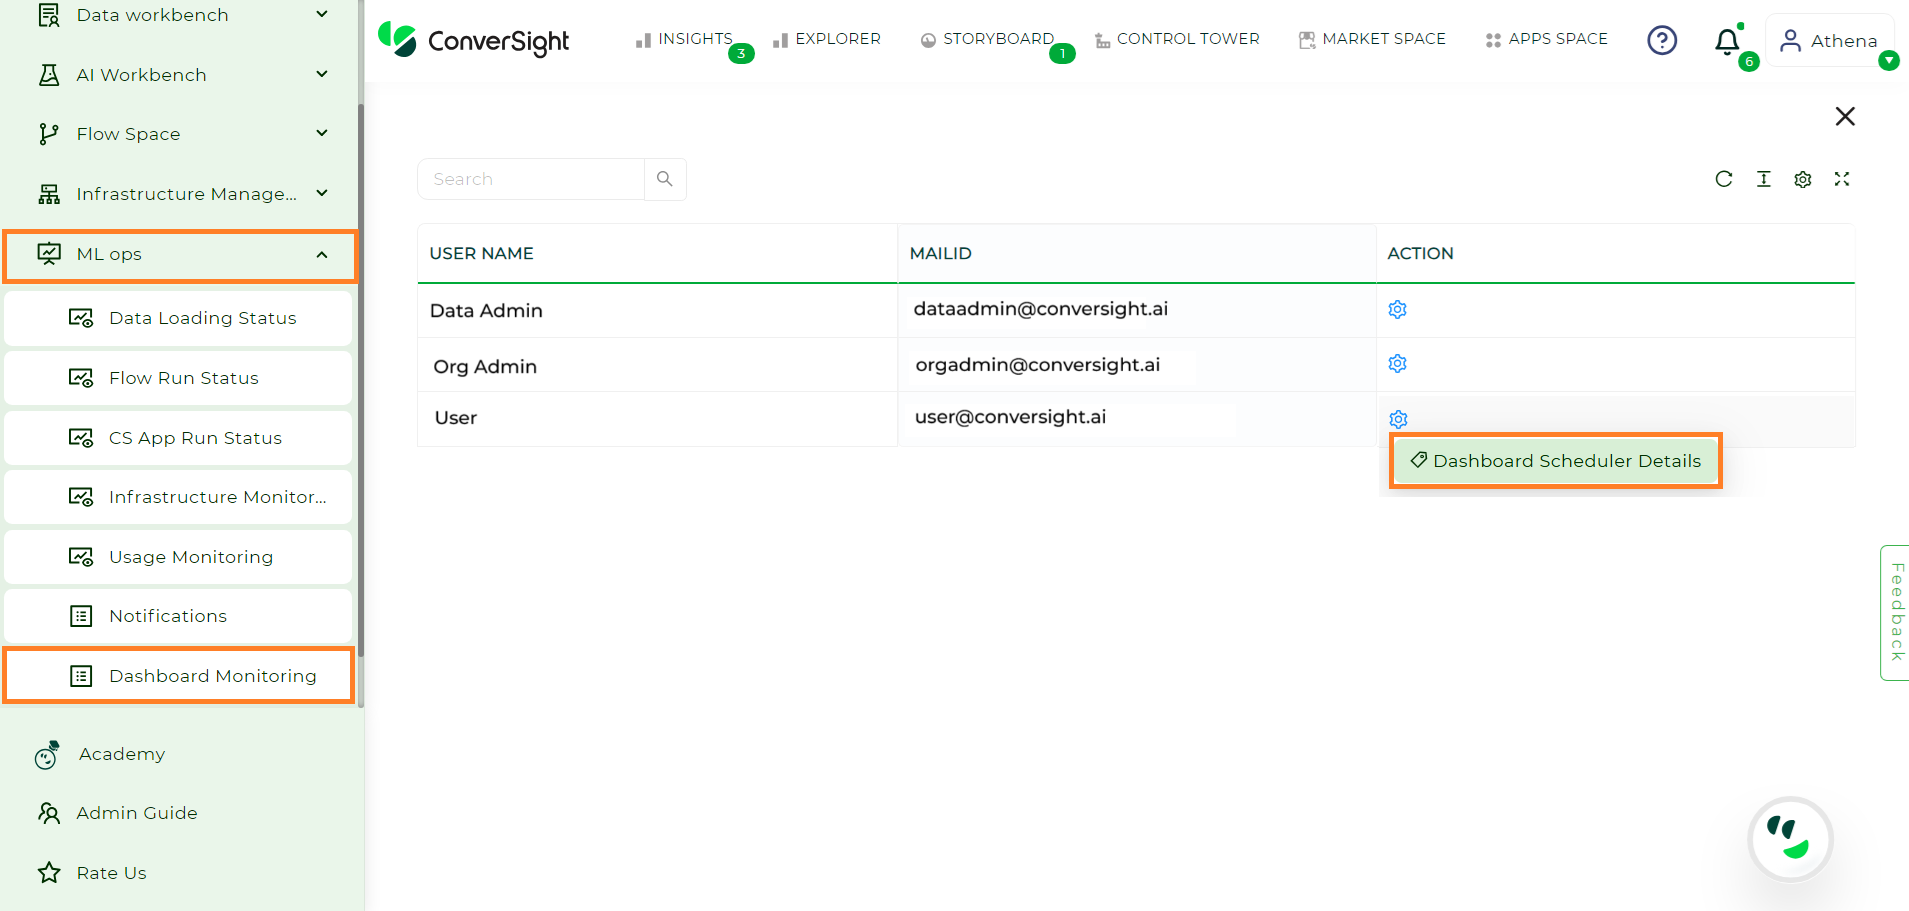
Dashboard monitoring presents a tabular format that includes user names, email addresses and action fields, providing access to the Dashboard Scheduler.
The Dashboard Scheduler functionality within ConverSight serves the purpose of enabling users to access a consolidated display of all Dashboards they have scheduled.
Dashboard Scheduler#
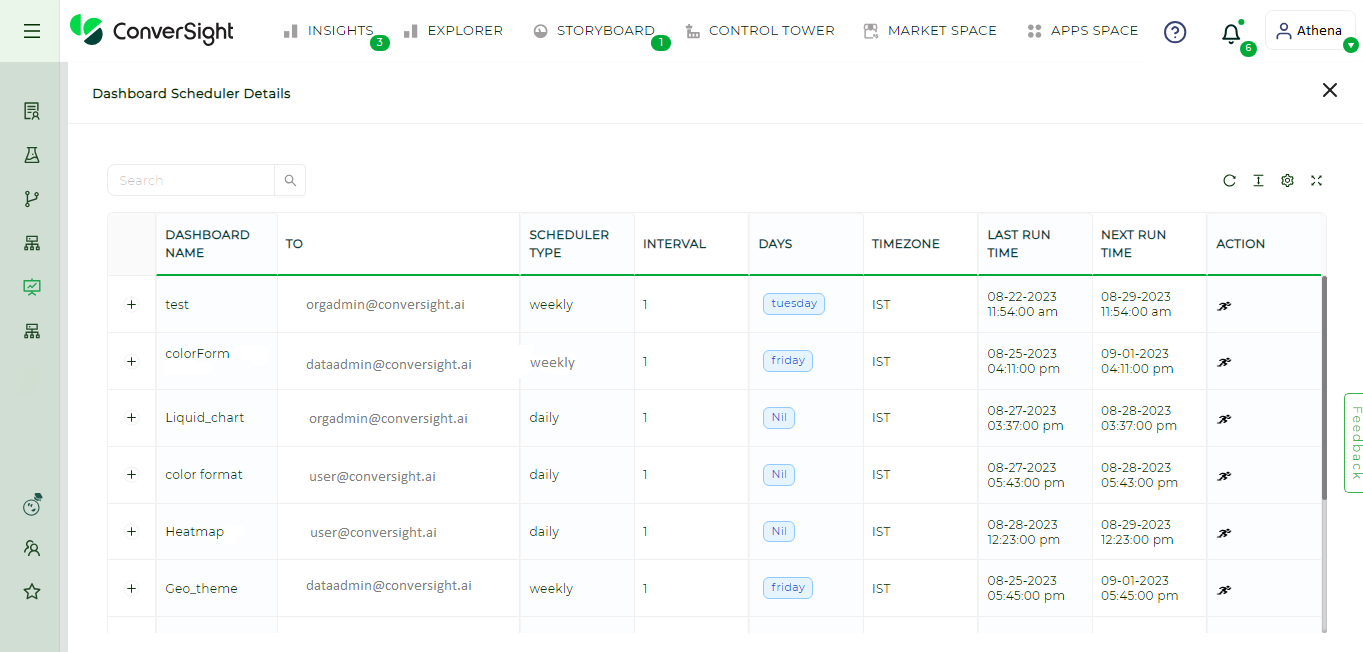
This feature provides a comprehensive view, highlighting crucial information pertaining to each scheduled Dashboard. The table includes the following columns.
Name |
Specification |
|---|---|
Dashboard Name |
Displays the name of the Scheduled Dashboard. |
To |
Presents the email address of the designated recipient for the scheduled activity. |
Scheduler Type |
Specifies whether Hourly, Daily, Weekly or Monthly. |
Interval |
Represents the duration between each schedule. |
Days |
Indicates the specific day of the week on which the scheduling has been configured. |
Time zone |
The default time zone is IST. |
Last Run Time |
Represents the previous run time of the schedule. |
Next Run Time |
Represents the next run time of the schedule. |
Action |
Enables you to run the specific schedule OnDemand. |
Dashboard Scheduler Page#
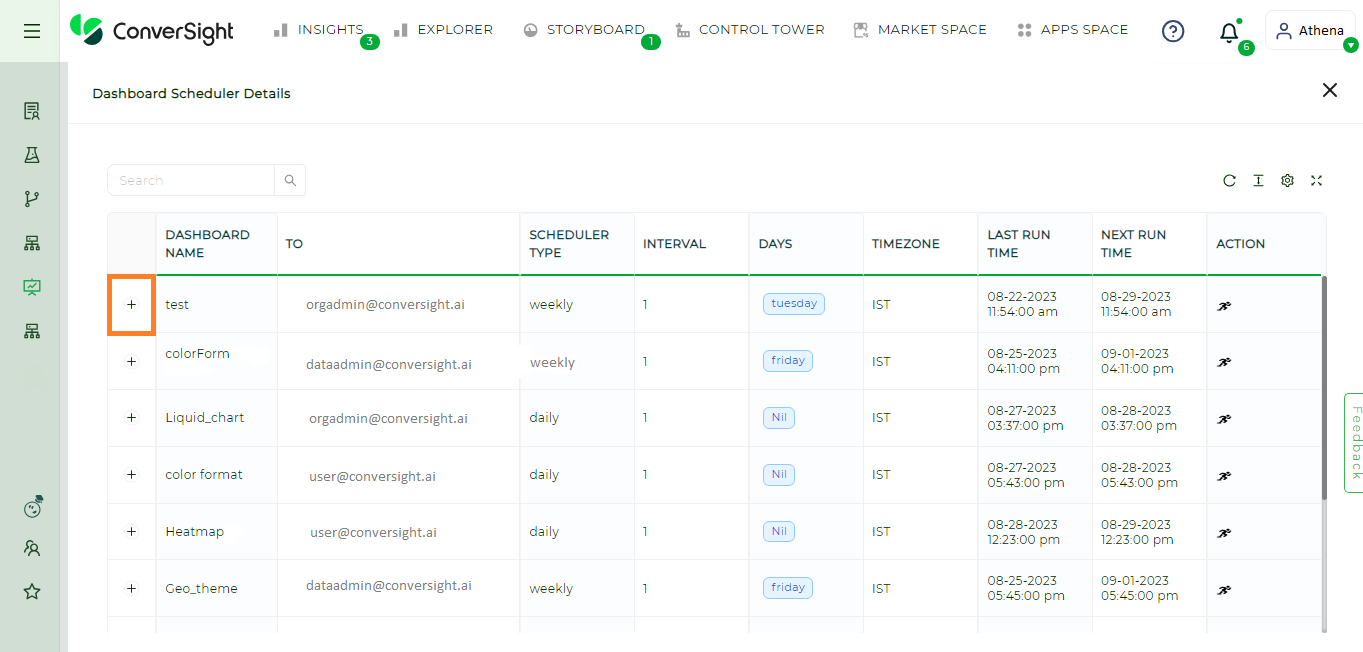
Upon selecting the “+” icon, the details of the specific schedule are presented.
Dashboard Scheduler Overview#
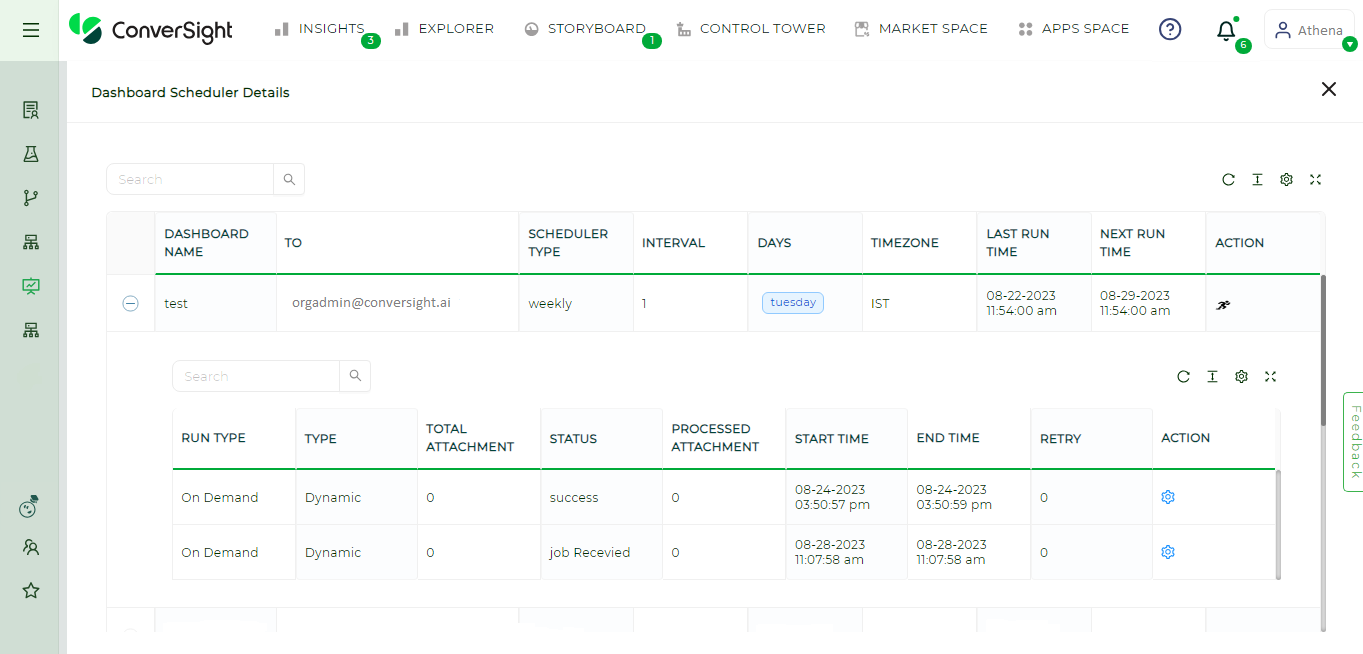
Dashboard Scheduler Details#
Here is a comprehensive overview of all the tabulated content within the Dashboard Scheduler.
Name |
Specification |
|---|---|
Run Type |
Displays whether OnDemand or Scheduled. OnDemand – Users have the option to manually trigger a schedule. Scheduled – The schedule runs as per configuration. |
Type |
Presents if Static or Dynamic. |
Total Attachment |
Shows the quantity of files contained within the Scheduled Dashboard. |
Status |
The status column shows the current state of the schedule, such as success, failed, job received. |
Processed Attachment |
Denotes the total count of files that have been included in the scheduling. |
Start Time |
Represents the starting time of the schedule. |
End Time |
Represents the ending time of the schedule. |
Retry |
The Retry column displays the count of attempts made before achieving success. |
Action |
Facilitates the ability to observe details of schedules that have been previously run. |
Dashboard Monitoring Status#
Status |
Description |
|---|---|
Initiated |
Clicking the Run icon initiates the scheduler status transition to Initiated. |
Processing |
The transition from Initiated to Processing in the scheduler signifies the transformation of Storyboard components into Excel format. |
Mail Processing |
The status progression from Processing to Mail Processing in the scheduler signifies the completion of converting Storyboard components into Excel format and initiates the mail sending process. |
Success |
The scheduler status changes to Success once the scheduled Storyboard mail has been sent successfully. |
Failed |
The scheduler status changes to Failed if the scheduler encounters challenges during the Processing or Mail Processing status. |
Dashboard Monitoring provides users with robust capabilities to efficiently oversee their created dashboards, including scheduled ones. This feature grants essential insights into dashboard operations, enhancing overall management.