Storyboard#
A Storyboard is a convenient way to view and organize all of the charts, graphs and insights that are relevant to you in one place. You can access all of the saved visualizations you have created and pin them to a Storyboard to create a custom display of your data.
Usage of Storyboard You can pin charts and tables to any Storyboard you have created and those that have been shared with you with the edit privilege. When you create a Storyboard, you can share it with other people with either the view or edit privilege. Storyboard are interactive and allows you to perform actions like filtering, excluding values and drilling down on the visualizations.
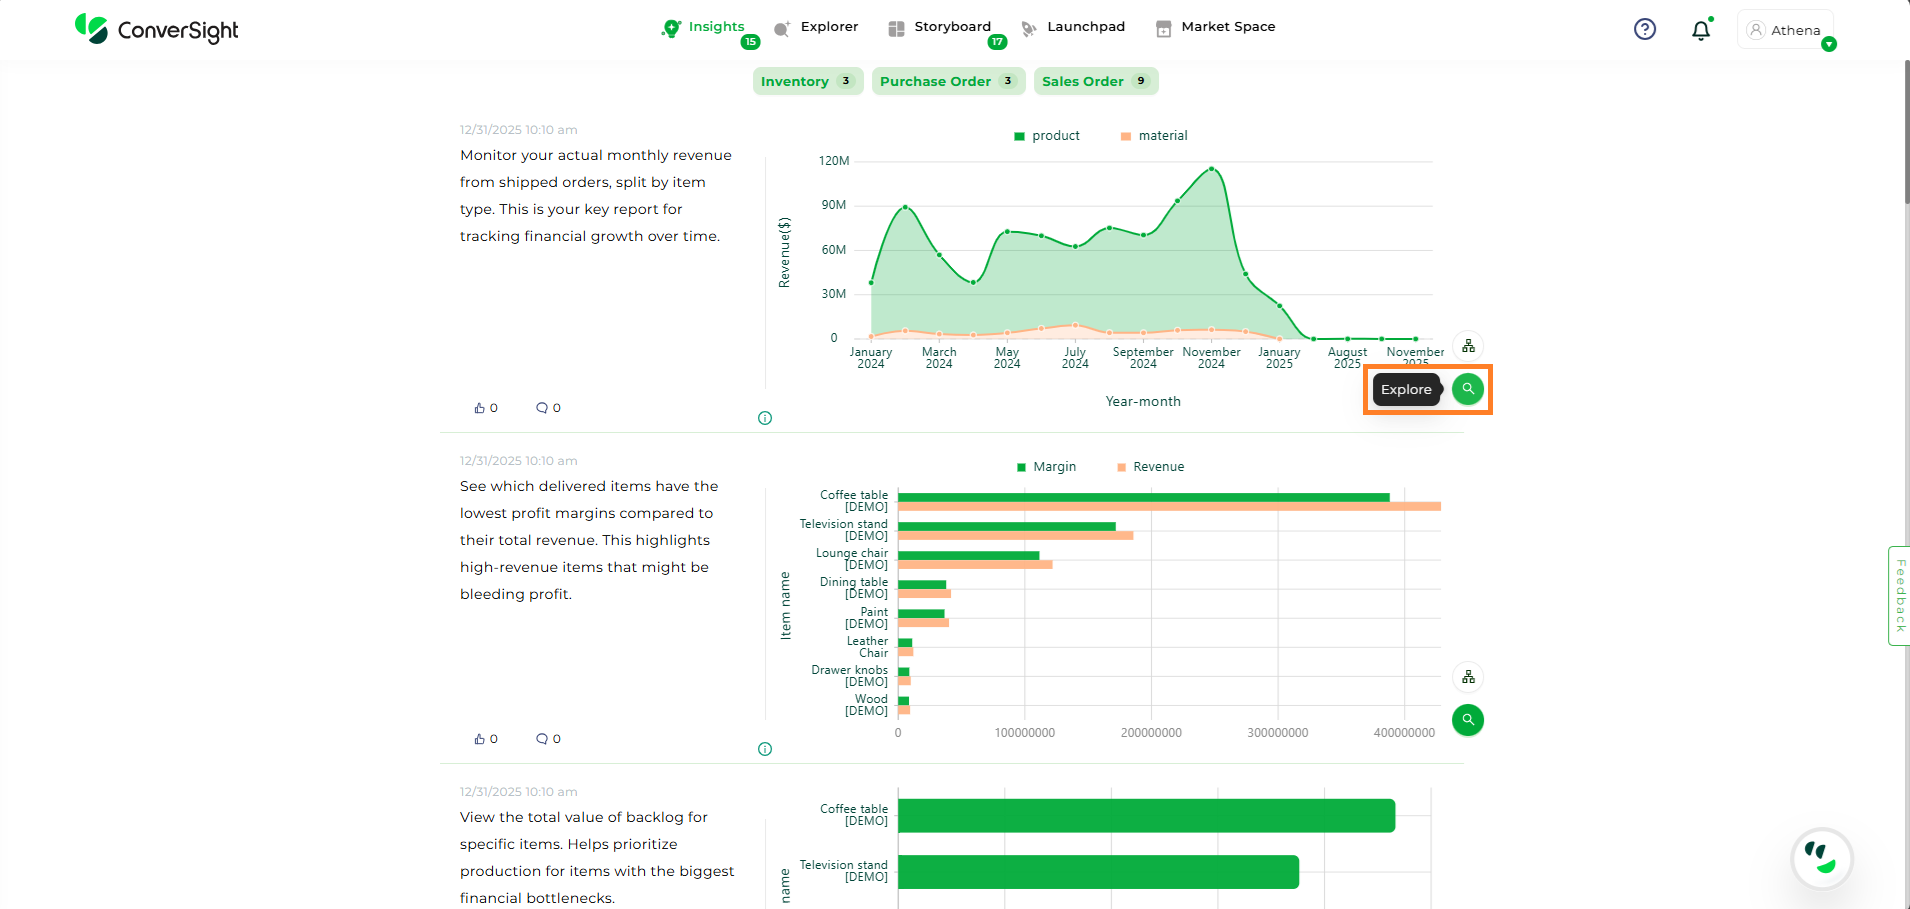
You can use the explore icon from any insight which you wish to add to Storyboard.
Insights#
Now, let’s add the insights to a Storyboard.
Add to Storyboard#
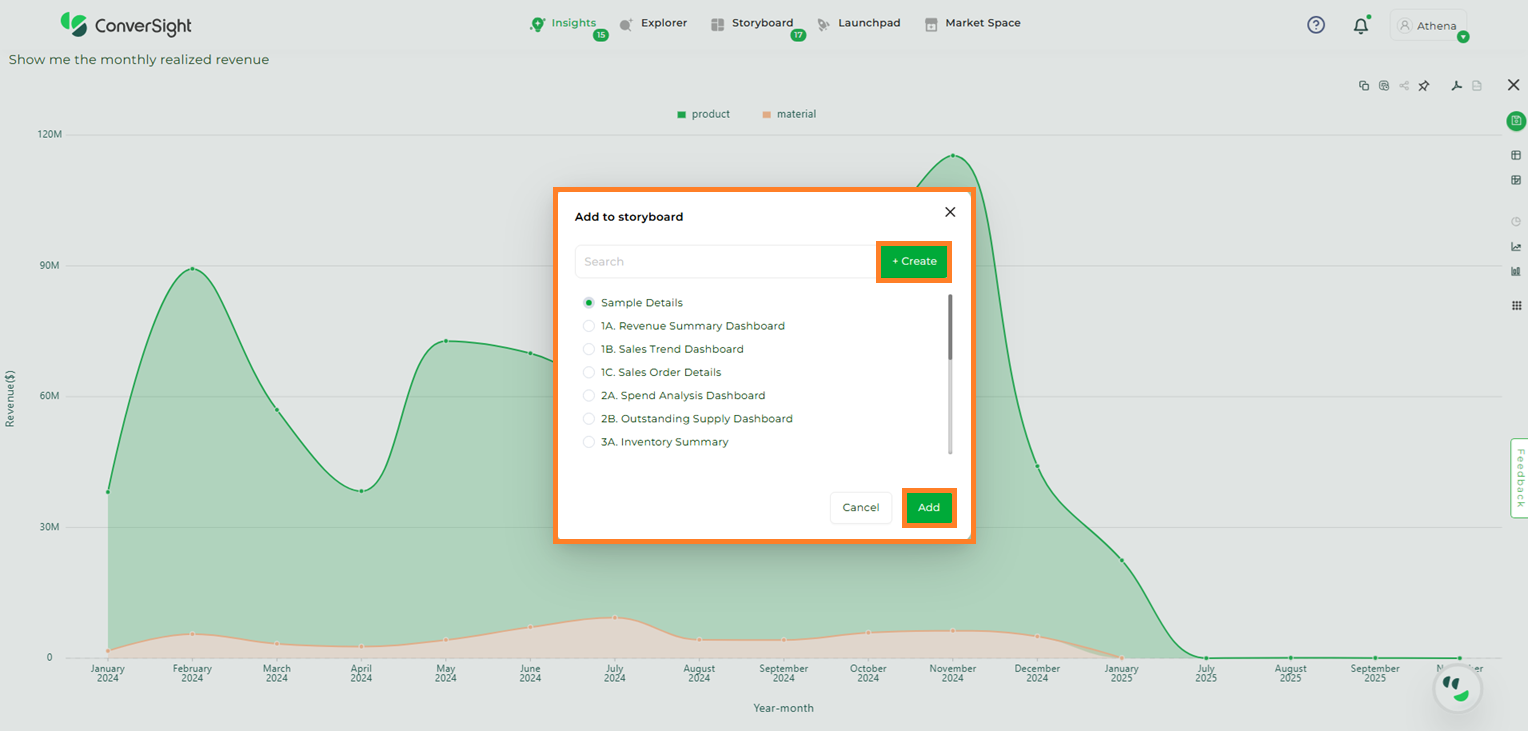
Click on the ![]() icon on the insights page, then you can add your query report to Storyboard. In the dialog box, you can click the + Create to create a new Storyboard or you can add the query report to existing Storyboard. In the dialog box, a list of existing Storyboards will be displayed, from which you can select one and click the Add button.
icon on the insights page, then you can add your query report to Storyboard. In the dialog box, you can click the + Create to create a new Storyboard or you can add the query report to existing Storyboard. In the dialog box, a list of existing Storyboards will be displayed, from which you can select one and click the Add button.
Create a New Storyboard#
Add a Storyboard
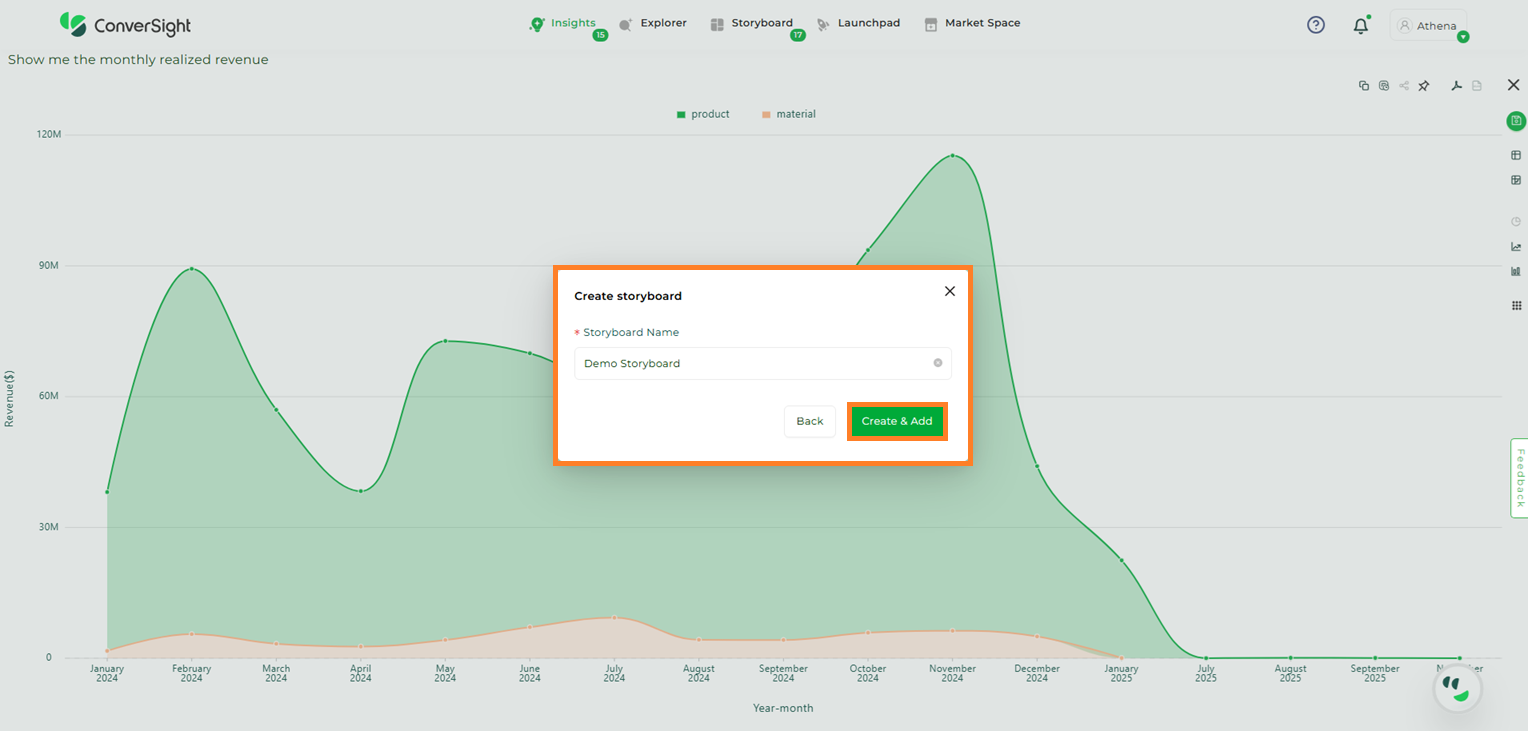
You will get the dialog box for adding to a Storyboard, enter a new Storyboard name, then click on the Create and Add button, which will then save it and add it to the Storyboard.
Create a New Storyboard#
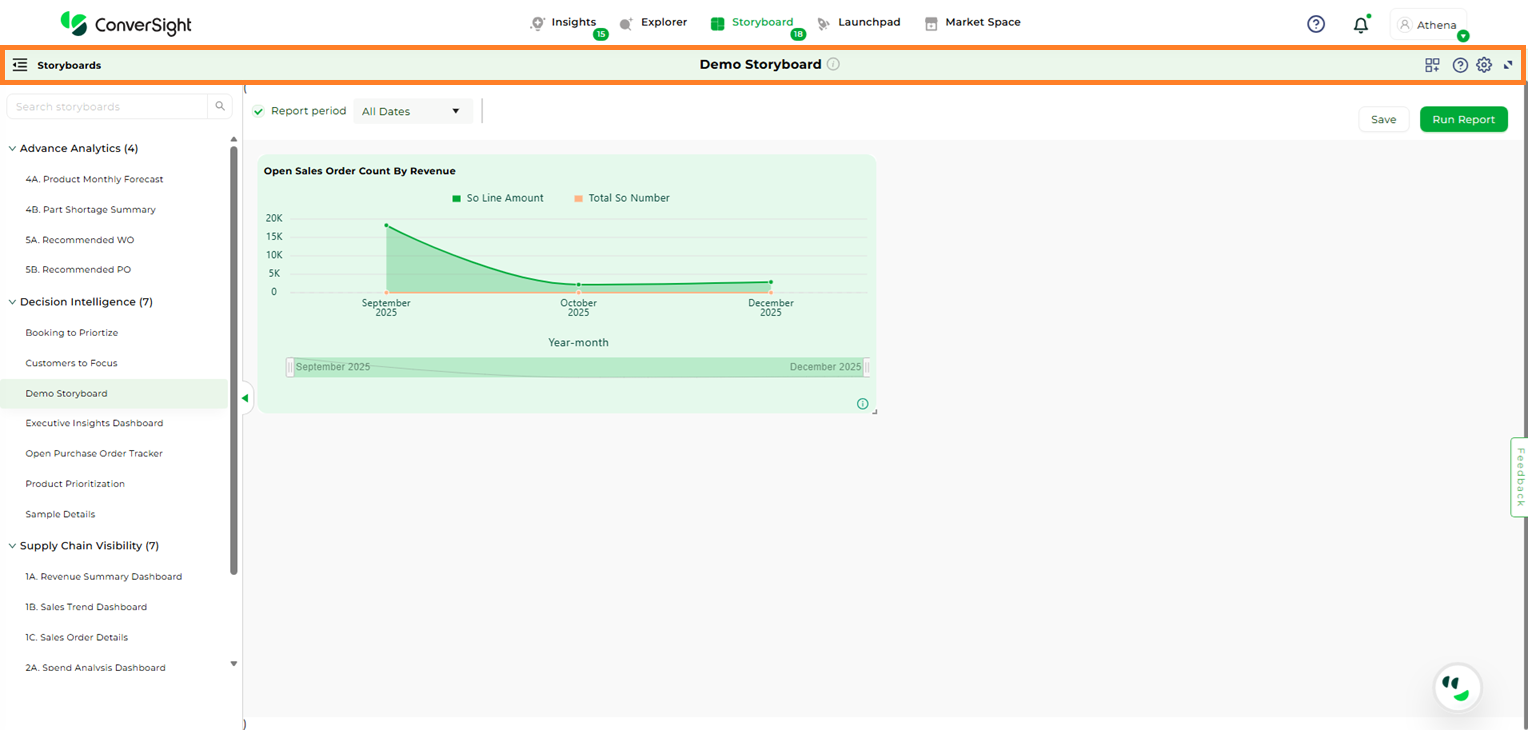
Here, a new Storyboard named Demo Storyboard is created.
Created a New Storyboard#
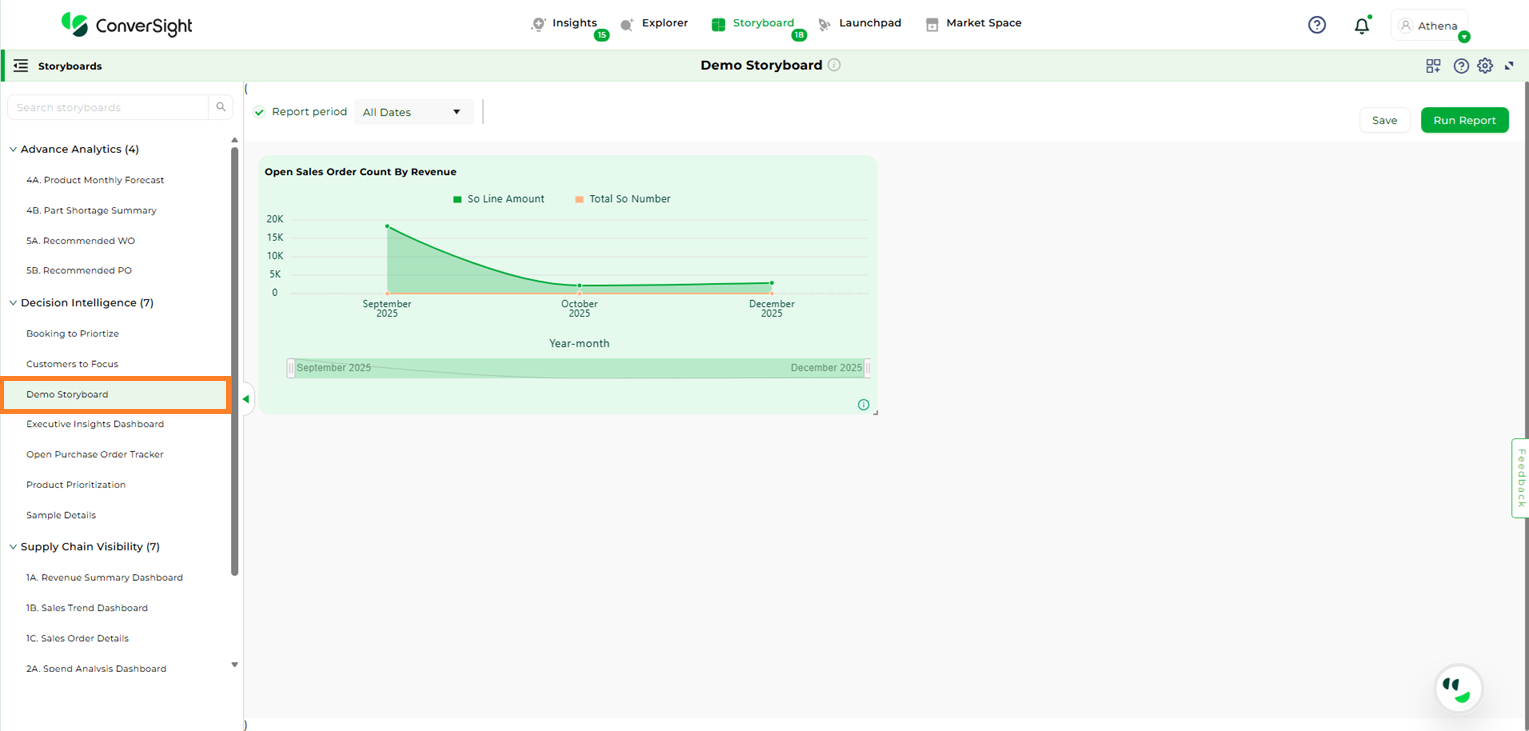
The name of the storyboard appears at the top of the page. Every storyboard is associated with a Business Area, which functions like a tag to help organize storyboards. For example, if you create a storyboard named Test, it will automatically be placed under the My Storyboard Business Area. You can change the assigned Business Area at any time while editing the storyboard.
Business Area#
Create Storyboard#
Create Storyboard allows users to directly create a storyboard within the storyboard page. By grouping related queries into a single view, users can build a clear data narrative that enhances analysis and collaboration.
Follow the steps below to create a storyboard:
Step 1: Click the Create Storyboard button.
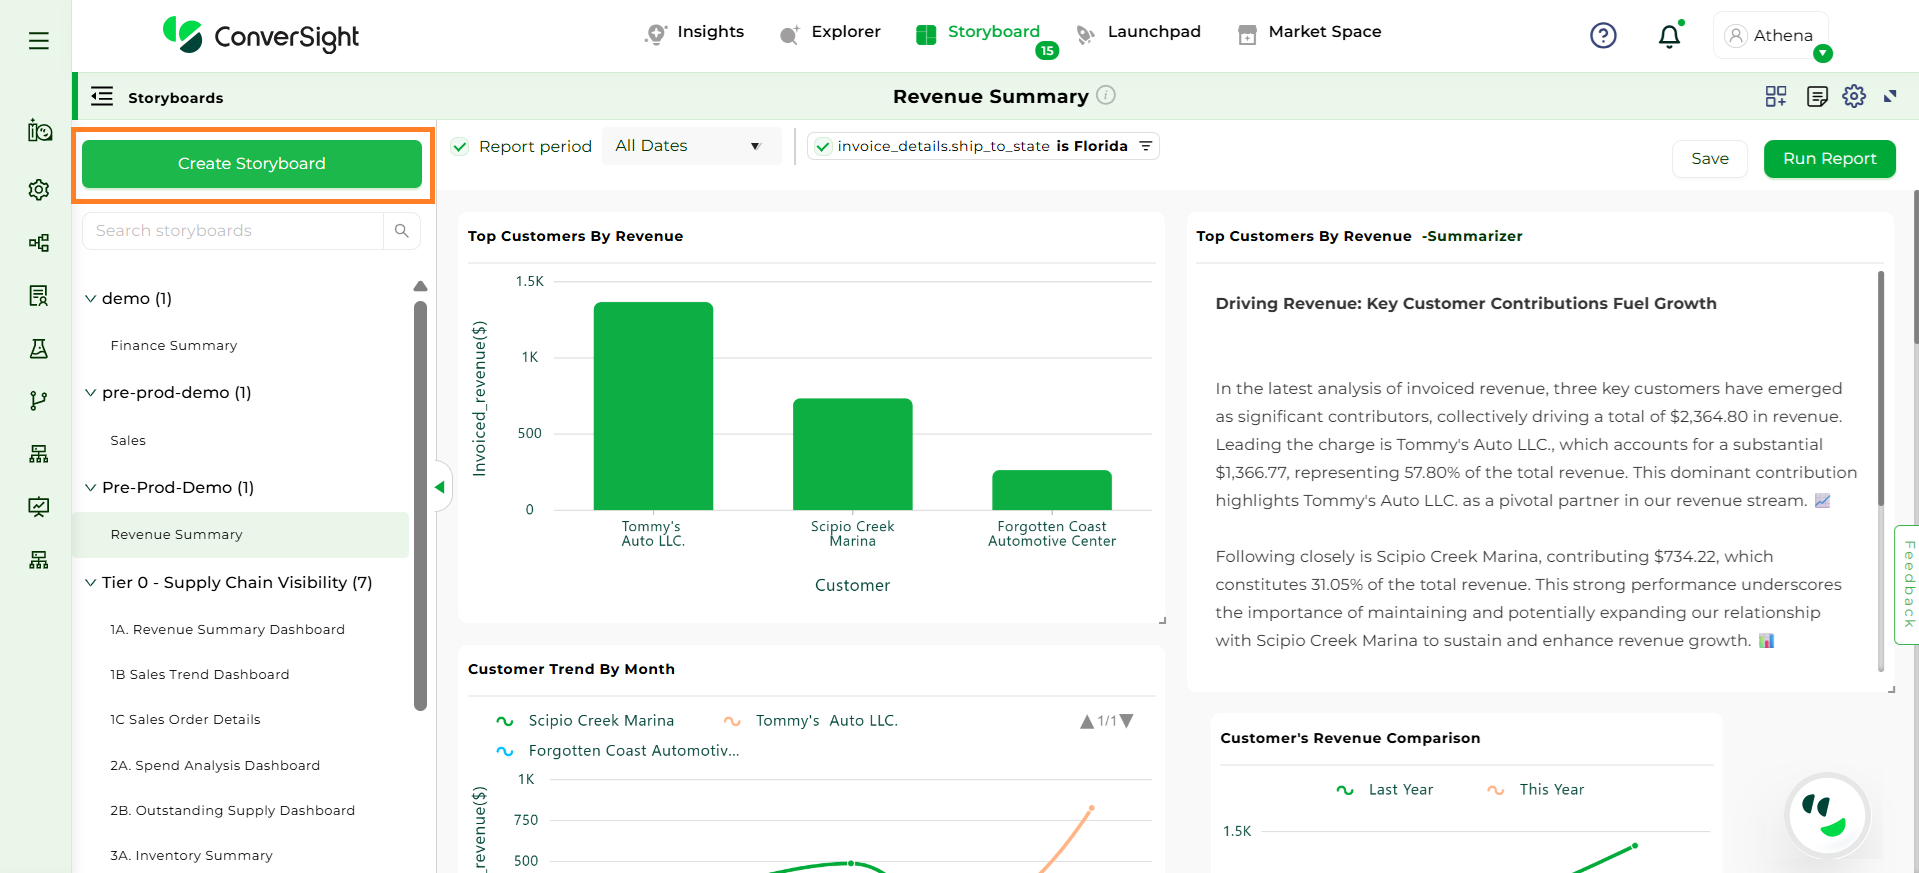
Create Storyboard#
Step 2: Enter the Storyboard Name. The Description and Business Area fields are optional.
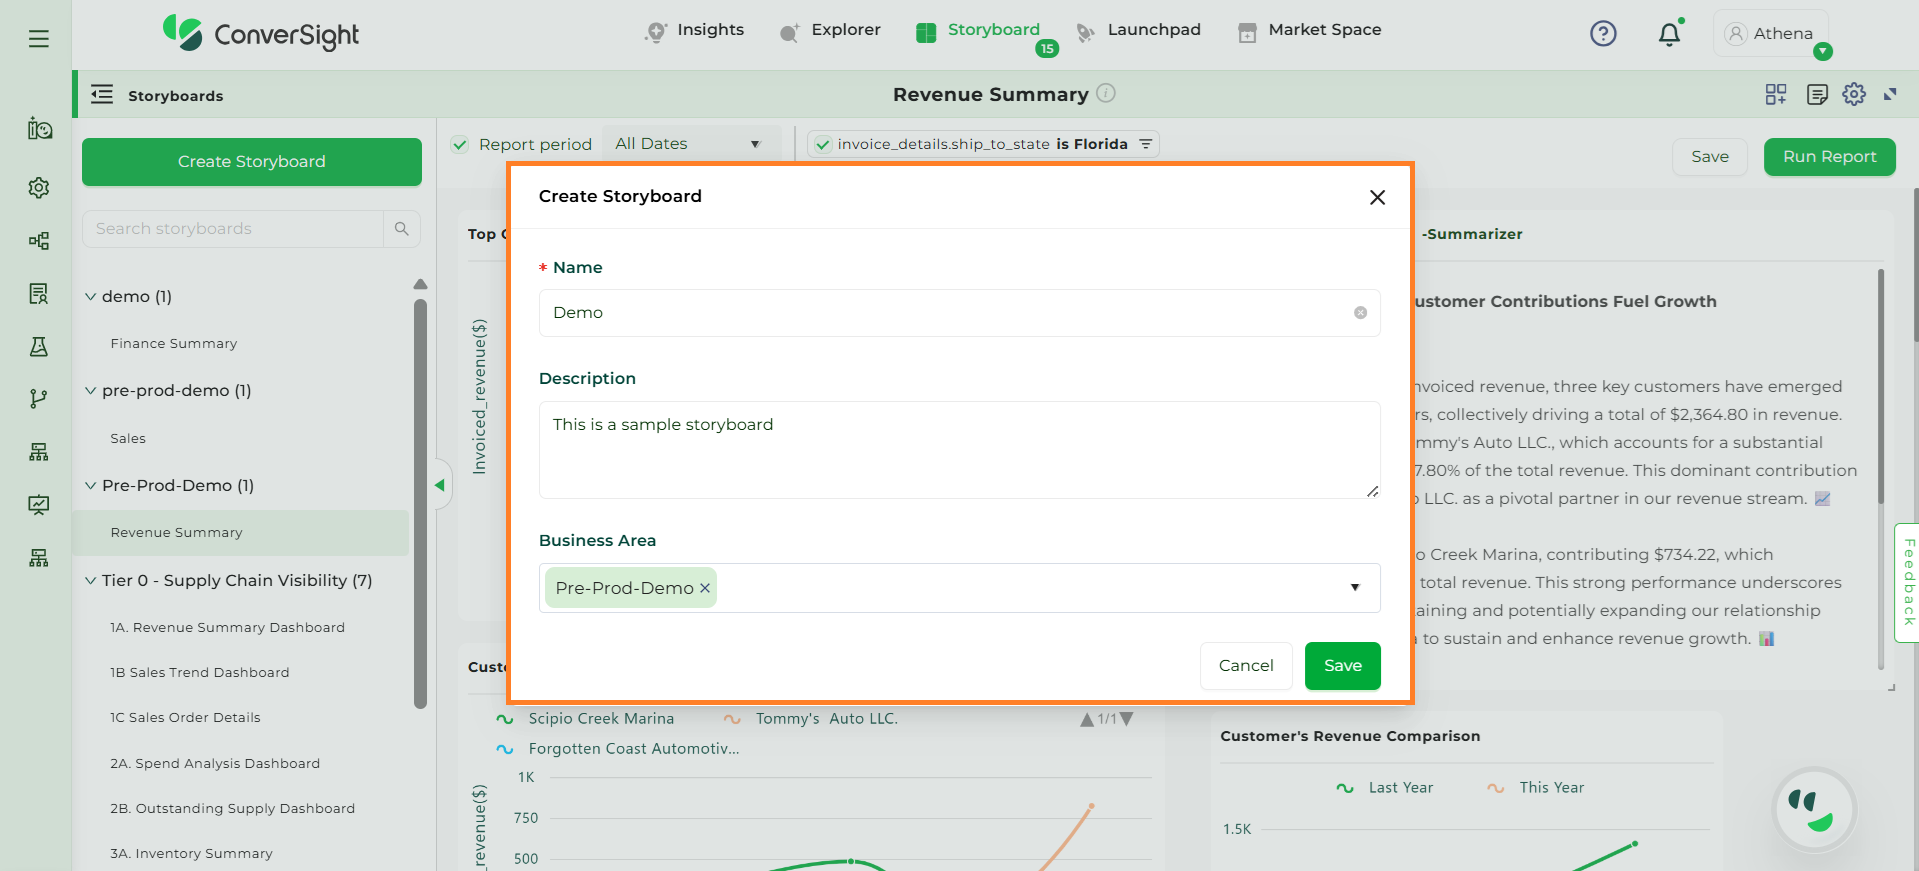
Create Storyboard#
Step 3: After completing the required configurations, click Save. A new Add New Report card will be generated for the storyboard.
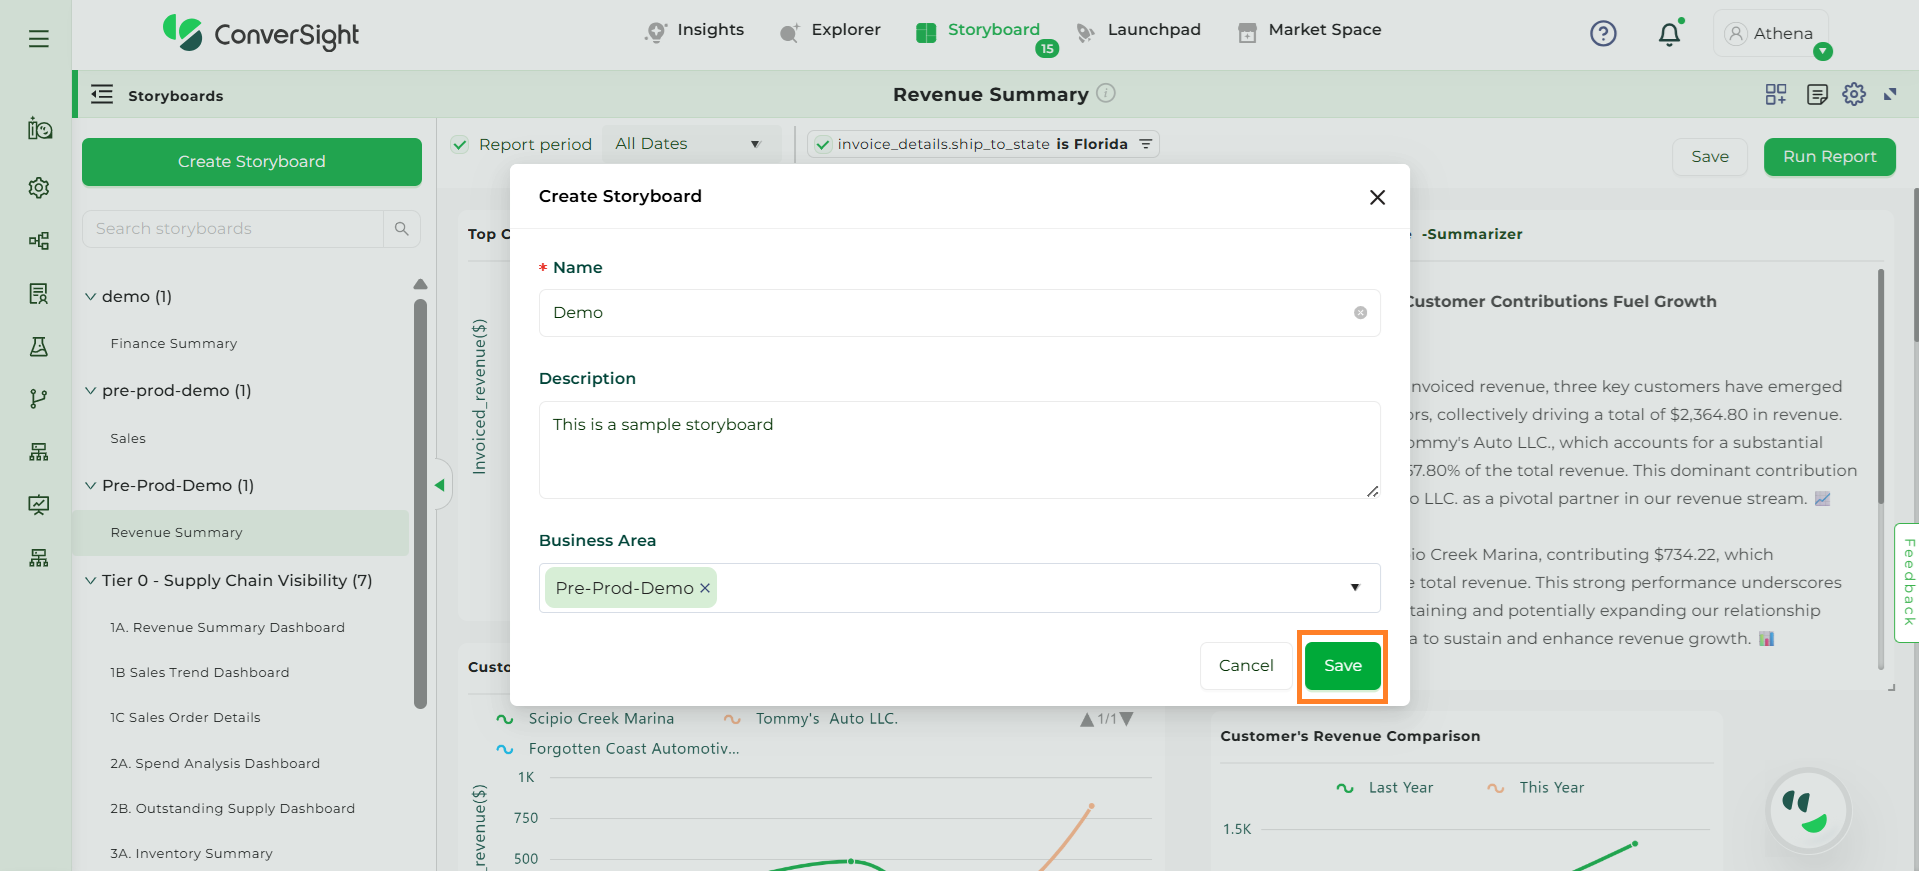
Create Storyboard#
Step 4: Click on the Add New Report which will open the Explorer.
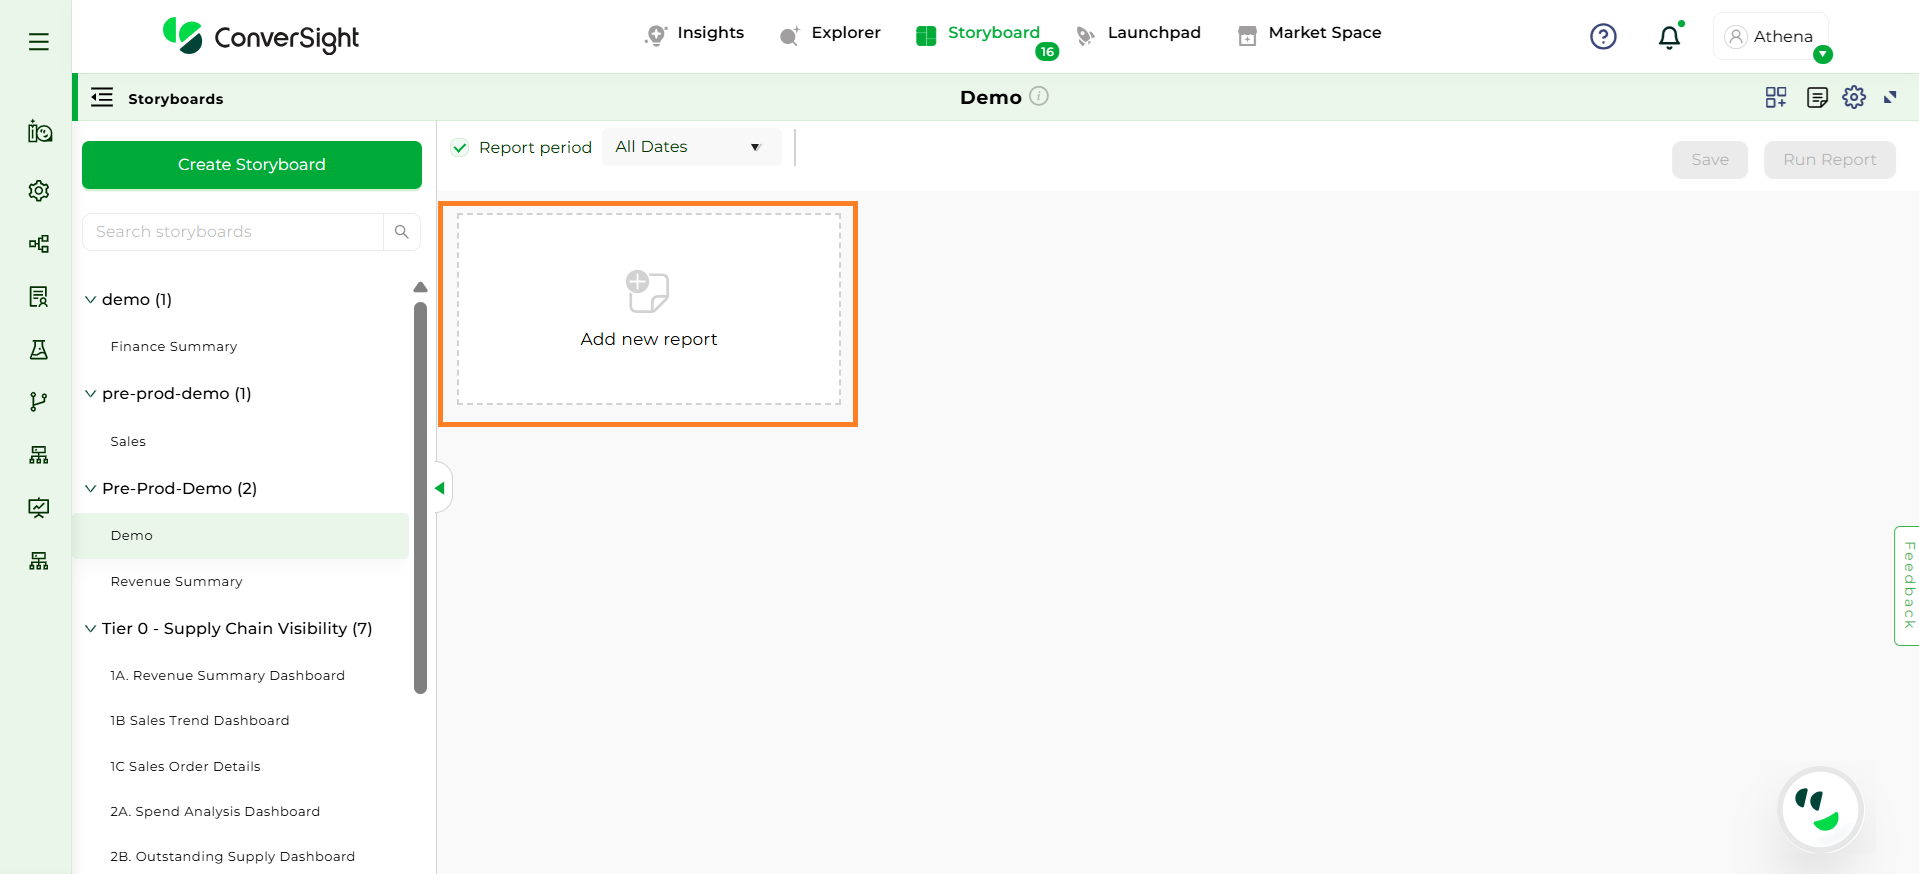
Add New Report#
Add New Report#
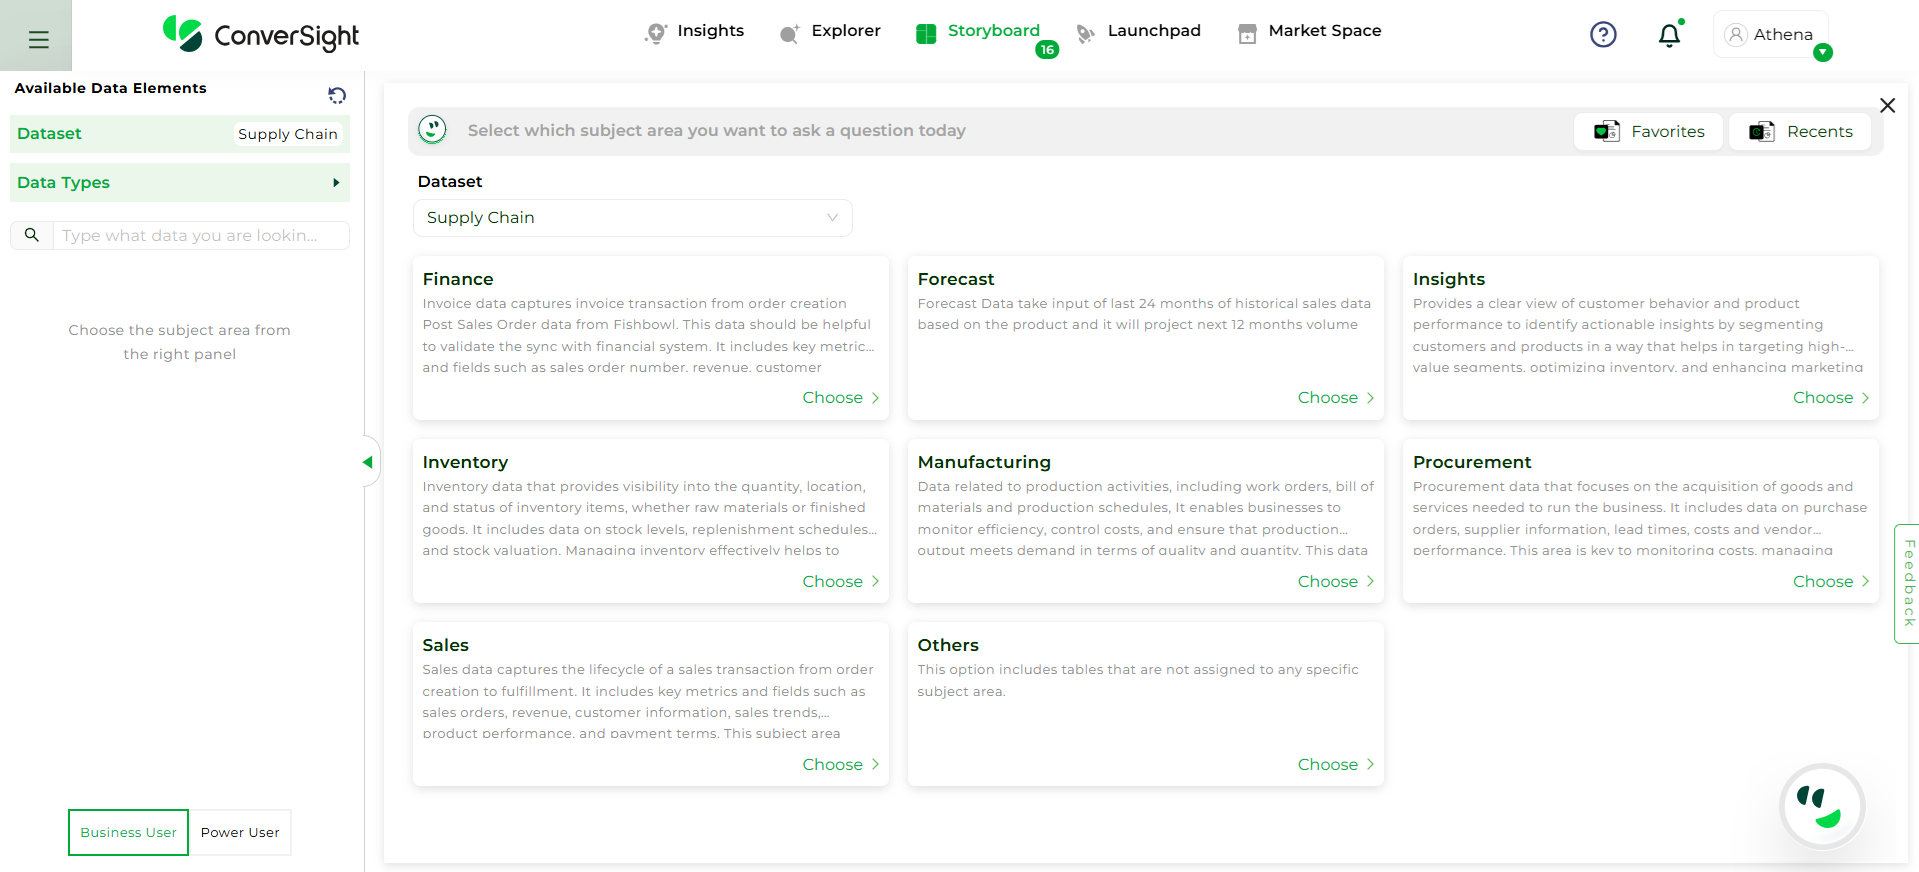
Step 5: Select the Dataset and choose the appropriate Subject Area, then create a query in Explorer as usual.
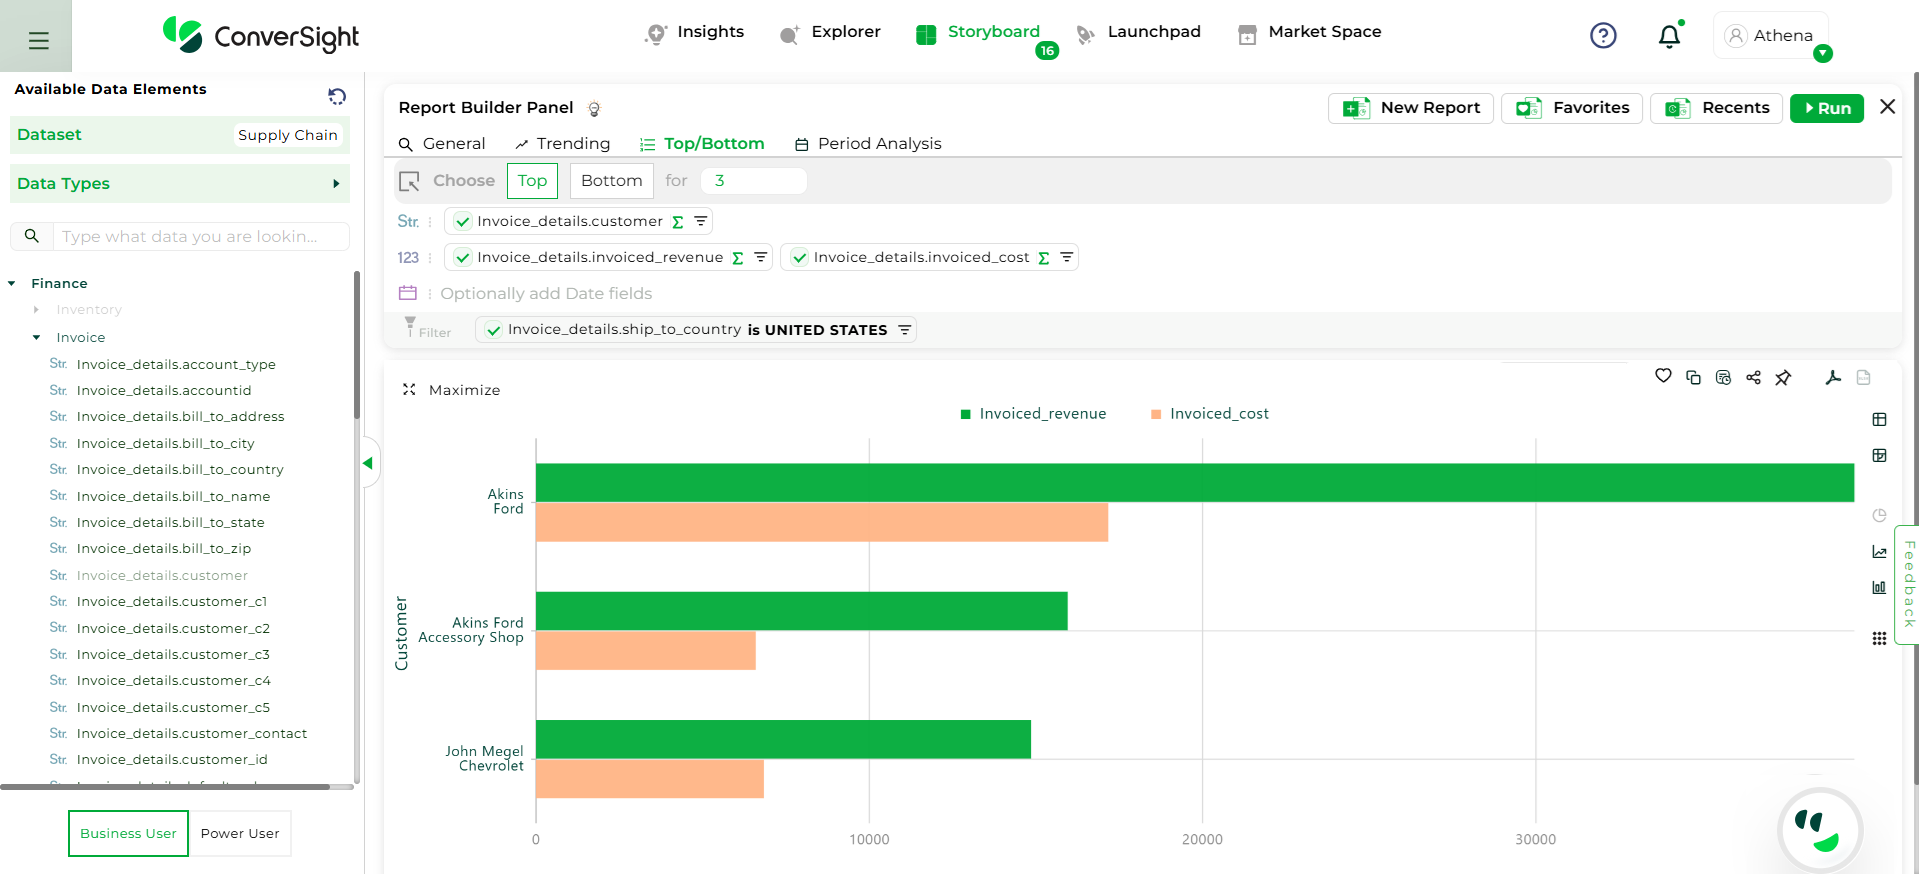
Add New Report#
To know more about how Explorer works, Click Here
Step 6: Once the query is generated, click Pin to add it to your storyboard for organized viewing.
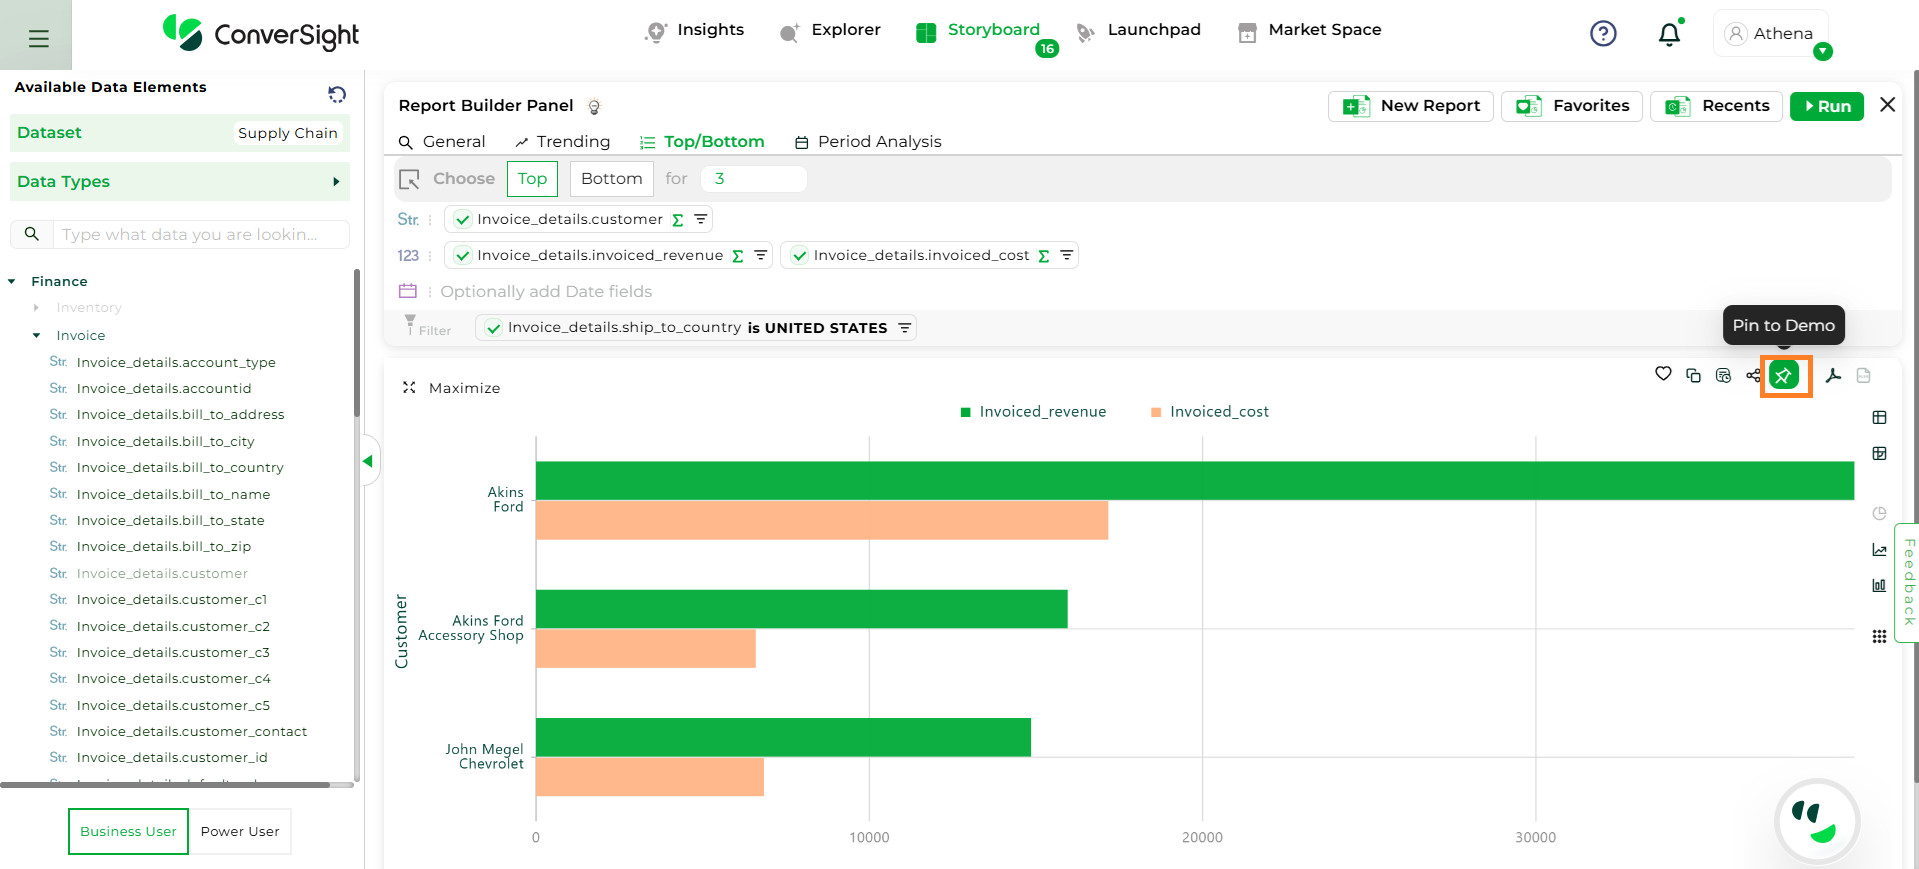
Pin to Storyboard#
List View#
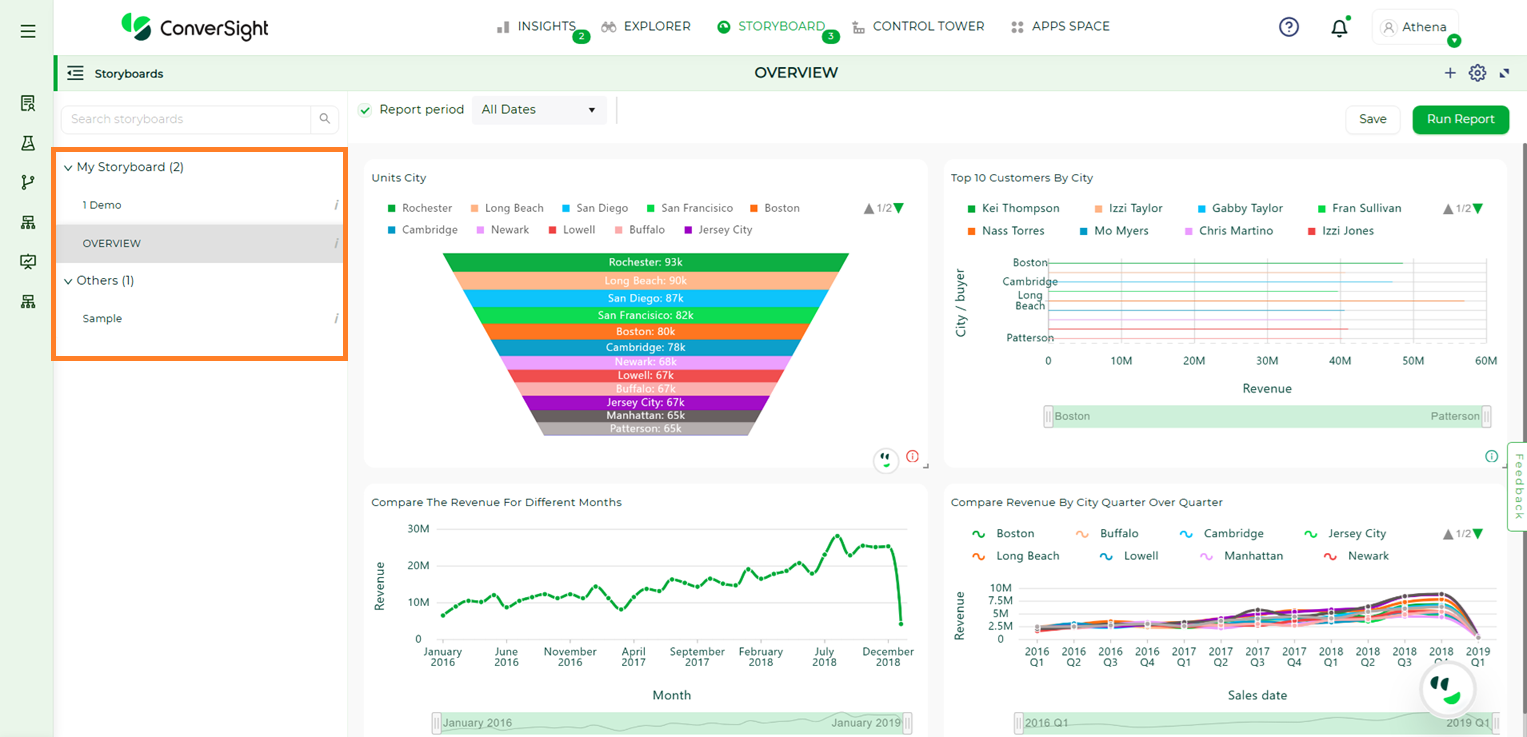
In the List View, all available Business Areas are shown in a list on the left side of the screen. Each storyboard is grouped under the Business Area it belongs to, making it easier to navigate and manage.

Storyboard List View#
To view the storyboards under a specific Business Area, simply click on the Business Area name to expand it. This helps you quickly find and access the relevant storyboards without having to search through everything manually.
Storyboard List View#
When you hover over the Info icon next to the storyboard name, you can view details such as the dataset name, creation date and time, last refresh date, and last edited date. If the storyboard was shared with you, it will also show the name of the person who shared it.
Storyboard Info#
To close the List View, simply click on the Storyboards icon.
Storyboard List View#
Help#
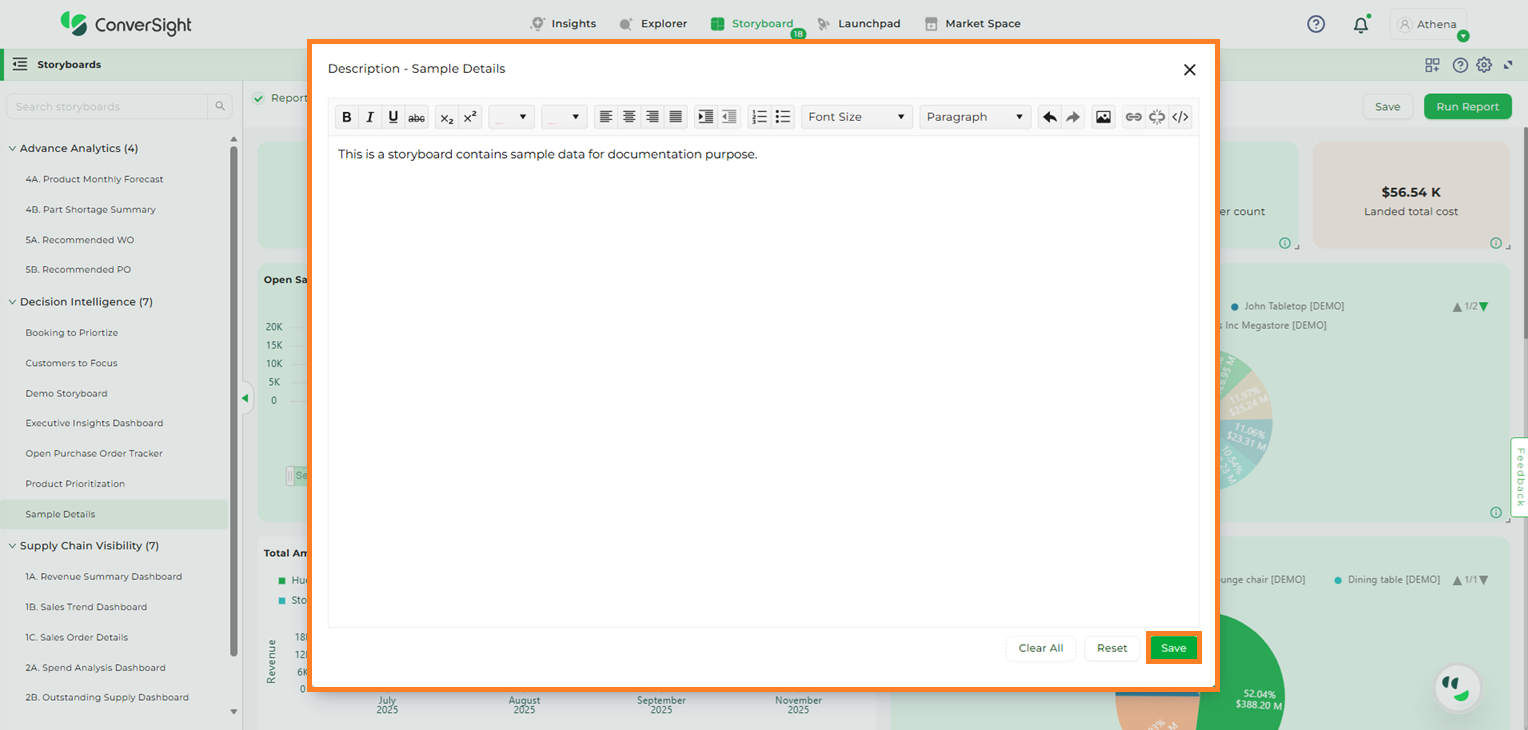
Click on the Help icon in the Storyboard page. You can add description about the Storyboard. So that when you share your Storyboard with others, they can read the description and make use of the Storyboard.
Help#
Along with the description, you can also add images as attachments for better understanding. Once done click on the Save button to apply the changes.
Help#
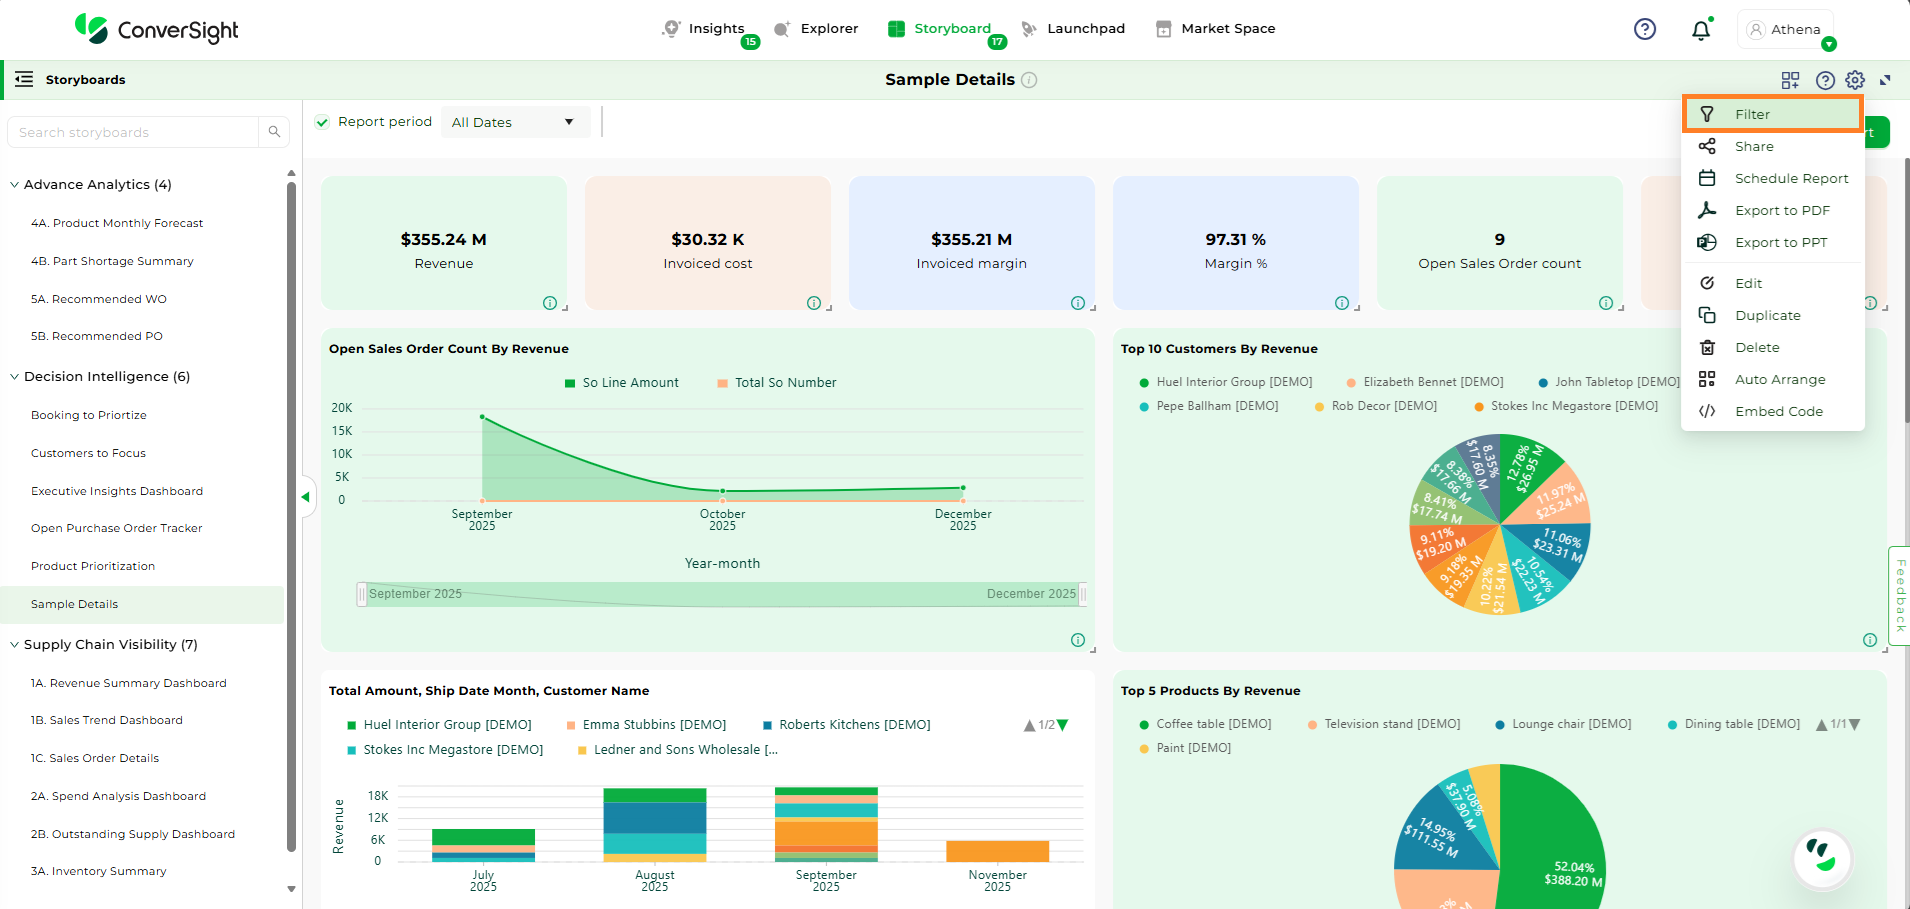
Filter#
Filters can be applied to Storyboards just as with tables and charts. These kinds of filters apply to an entire Storyboard, making it easy to see only the data that you are interested in across the tables and charts within a Storyboard.
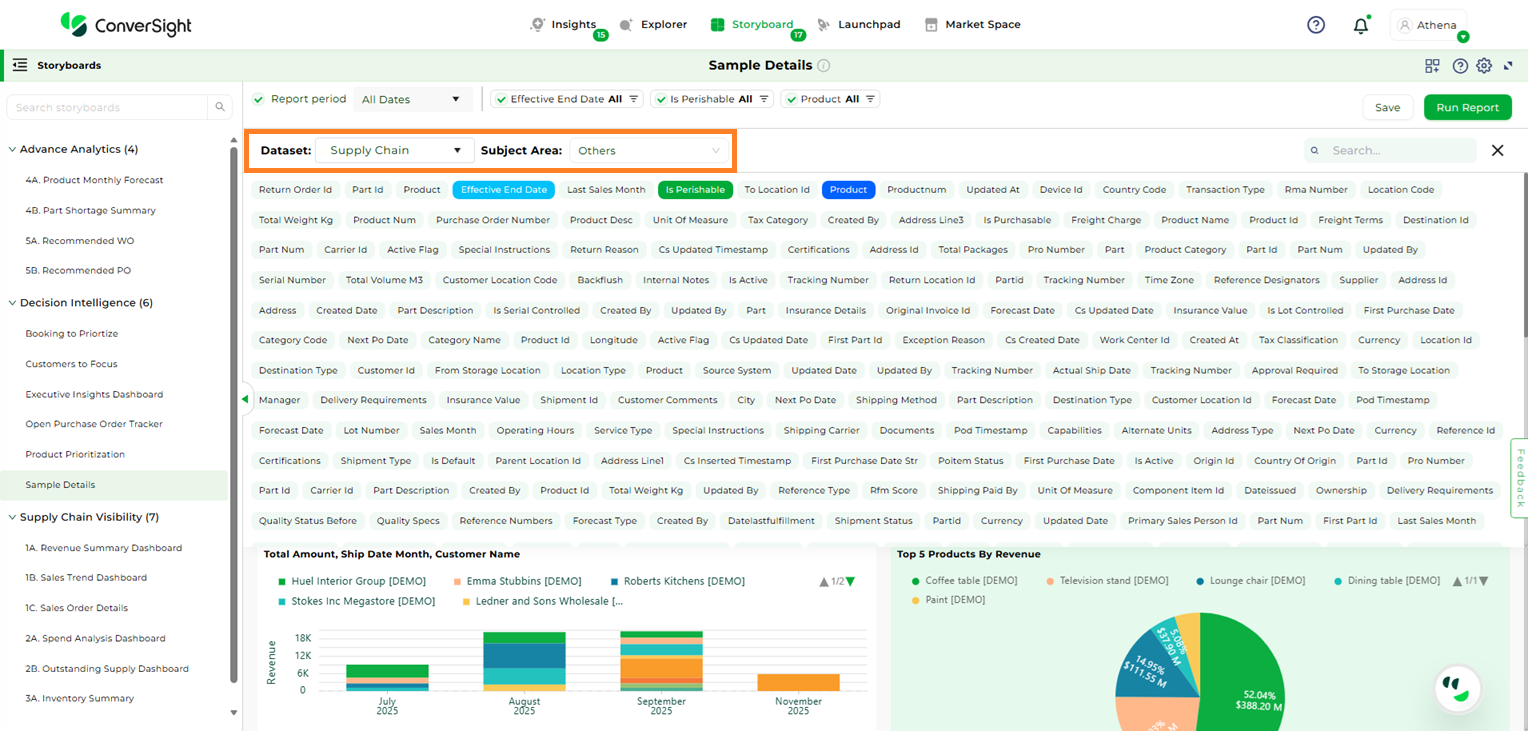
Clicking the Filter icon opens a panel displaying the Dataset, Subject Area, and a list of columns from the table associated with the selected dataset and subject area. From this list, you can choose the specific column you want to apply a filter to.
Storyboard Filters#
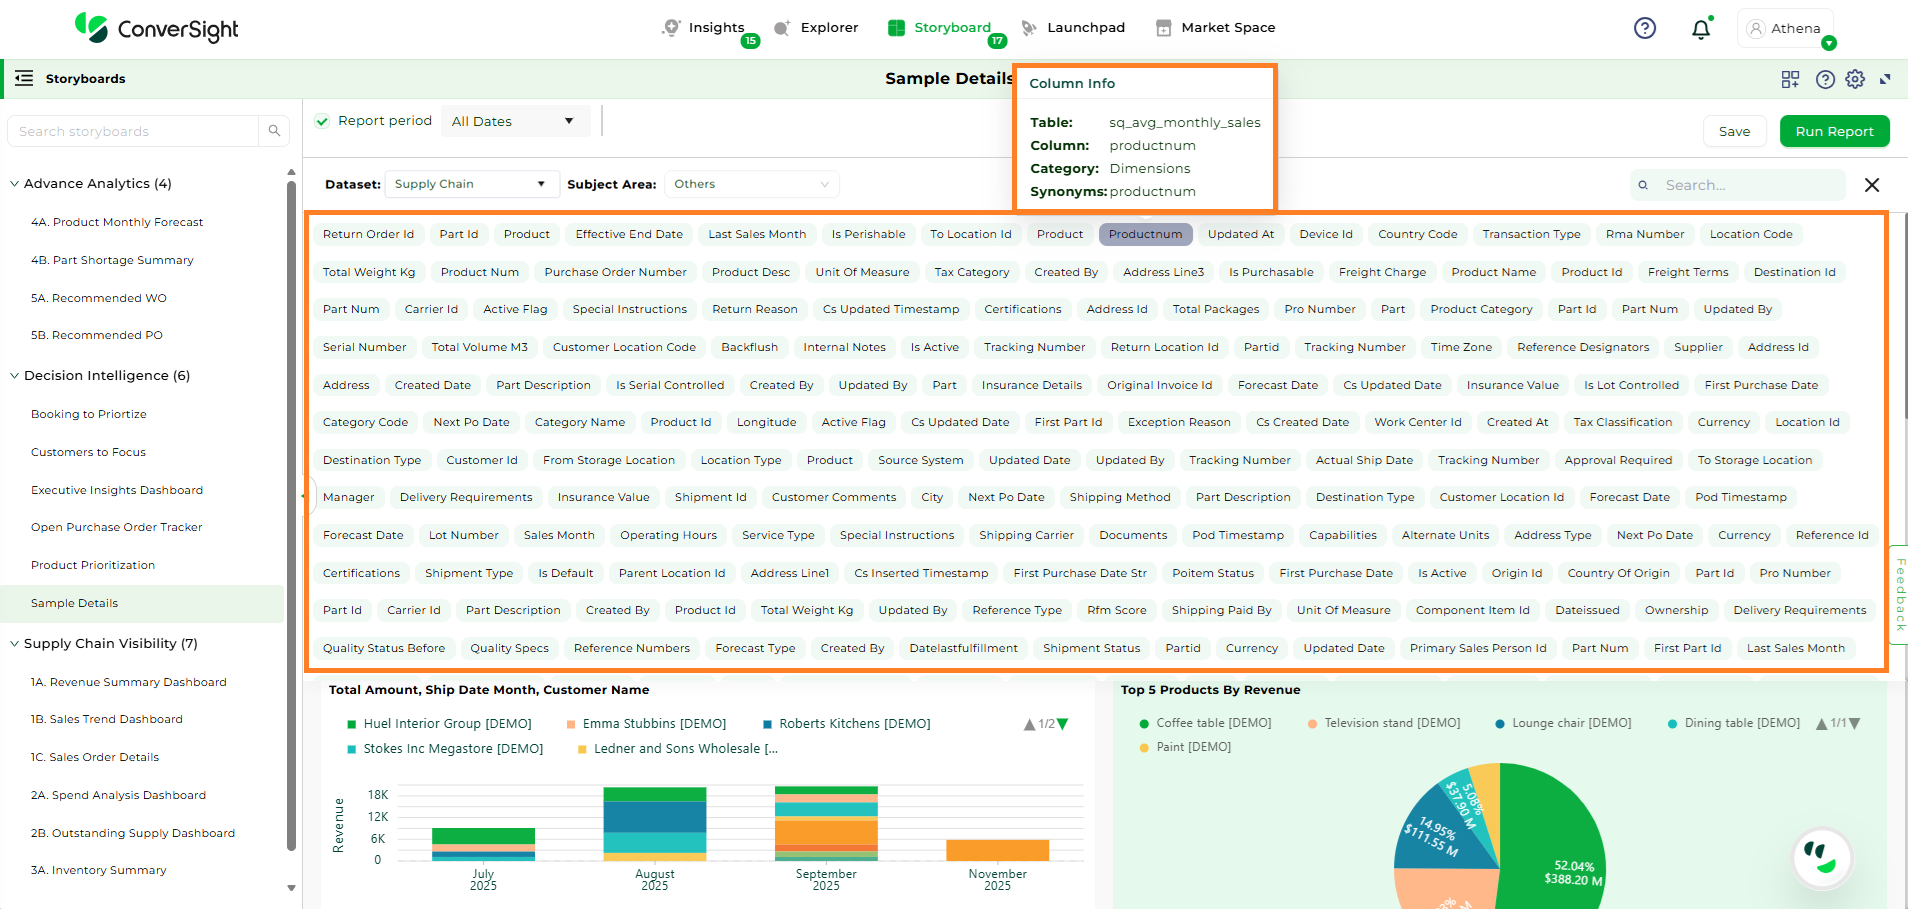
Hovering over the columns will display the details of the columns
Column Details#
You can filter columns by selecting the desired Dataset and Subject Area. The chosen filter columns will appear in the Filter section. Once you’ve made your selections, click the Close icon to exit the panel.
Column Details#
If the selected Filter’s column category is a dimension, you can choose an operator for the value in the column.
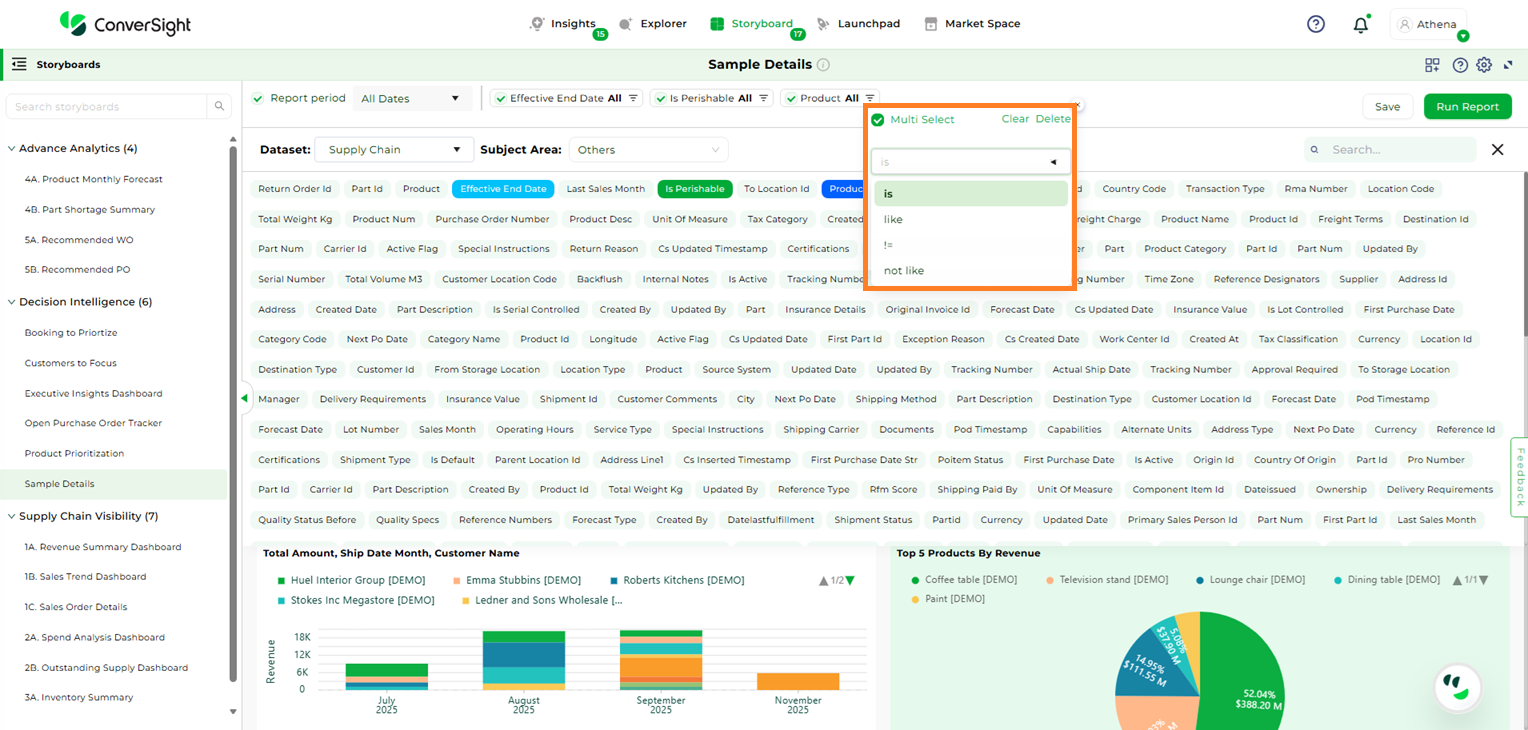
Dimension Column#
If the column falls under the date category, you have the flexibility to pick different date values.
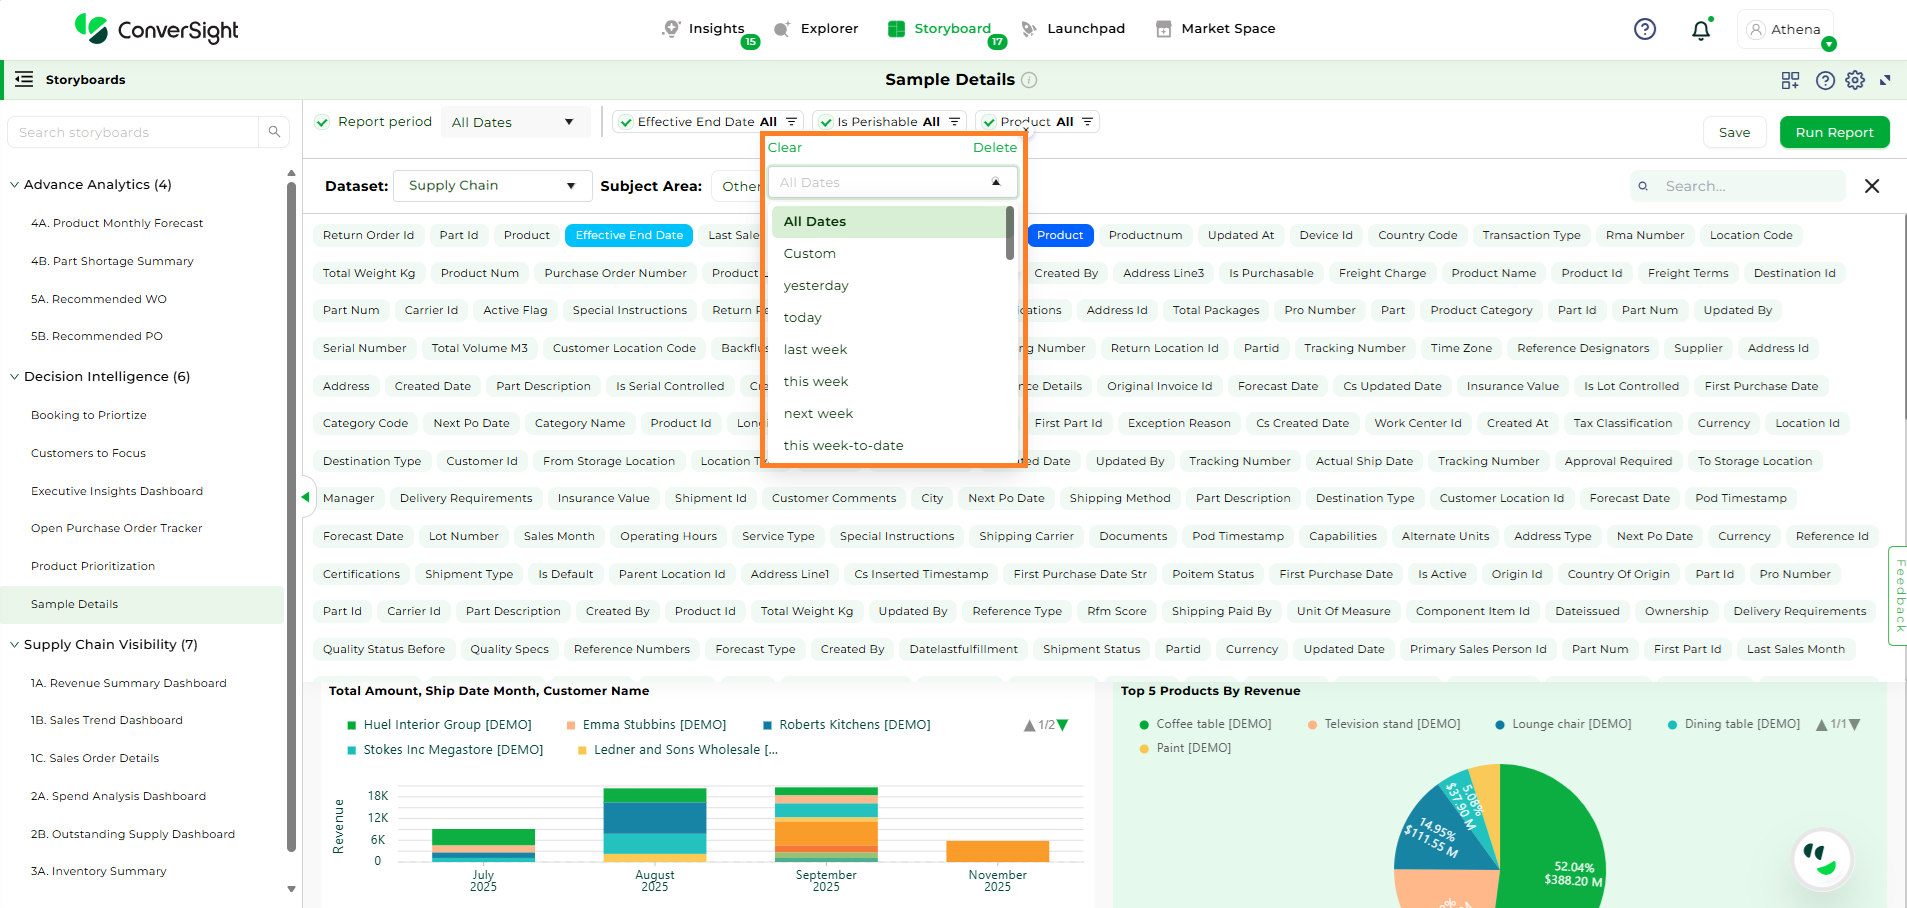
Date Column#
Once you’ve made your selections, click Run Report to generate a visualization output. If you want to keep this output for later, you can choose to Save it. Saving the visualization makes it permanently available for reference and use whenever you need it.
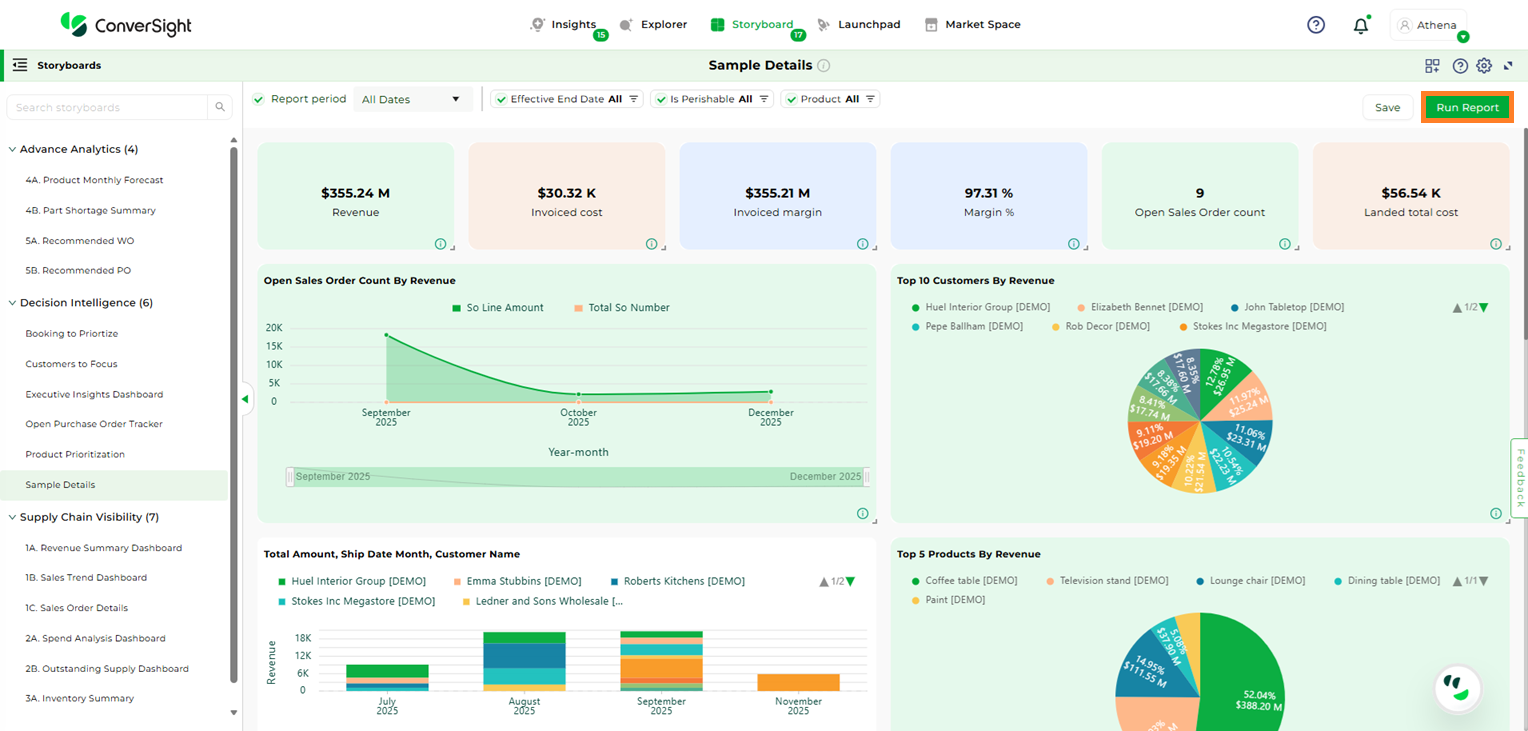
Run Report#
The Report period feature is a handy way to filter data based on specific dates.
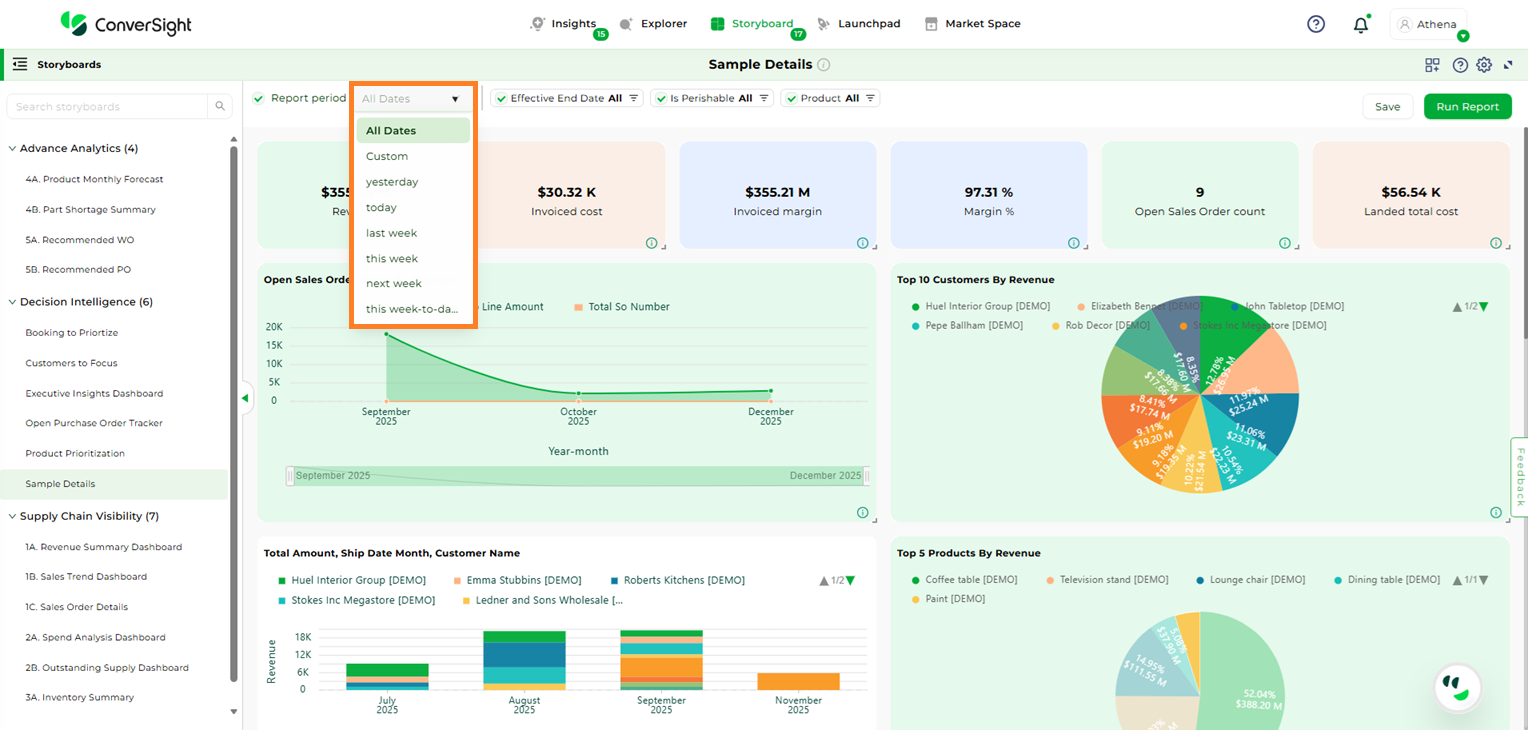
Report period#
NOTE
If the category of the column is metric or calculated metric, the Storyboard filters will not be applicable.
Share#
Shared Storyboards are like a folder. You will have all the Storyboards that have been shared with you by others. When you click on Selected Storyboard shared by others using the Shared Storyboards, you will get the graph report. You can download by exporting it as a PDF or a Word document or you can view using different types of chart lists.
To watch the video, click on Sharing Storyboards.
Click on the Settings icon and select Share icon from the Storyboard page. You can share the selected Storyboard.
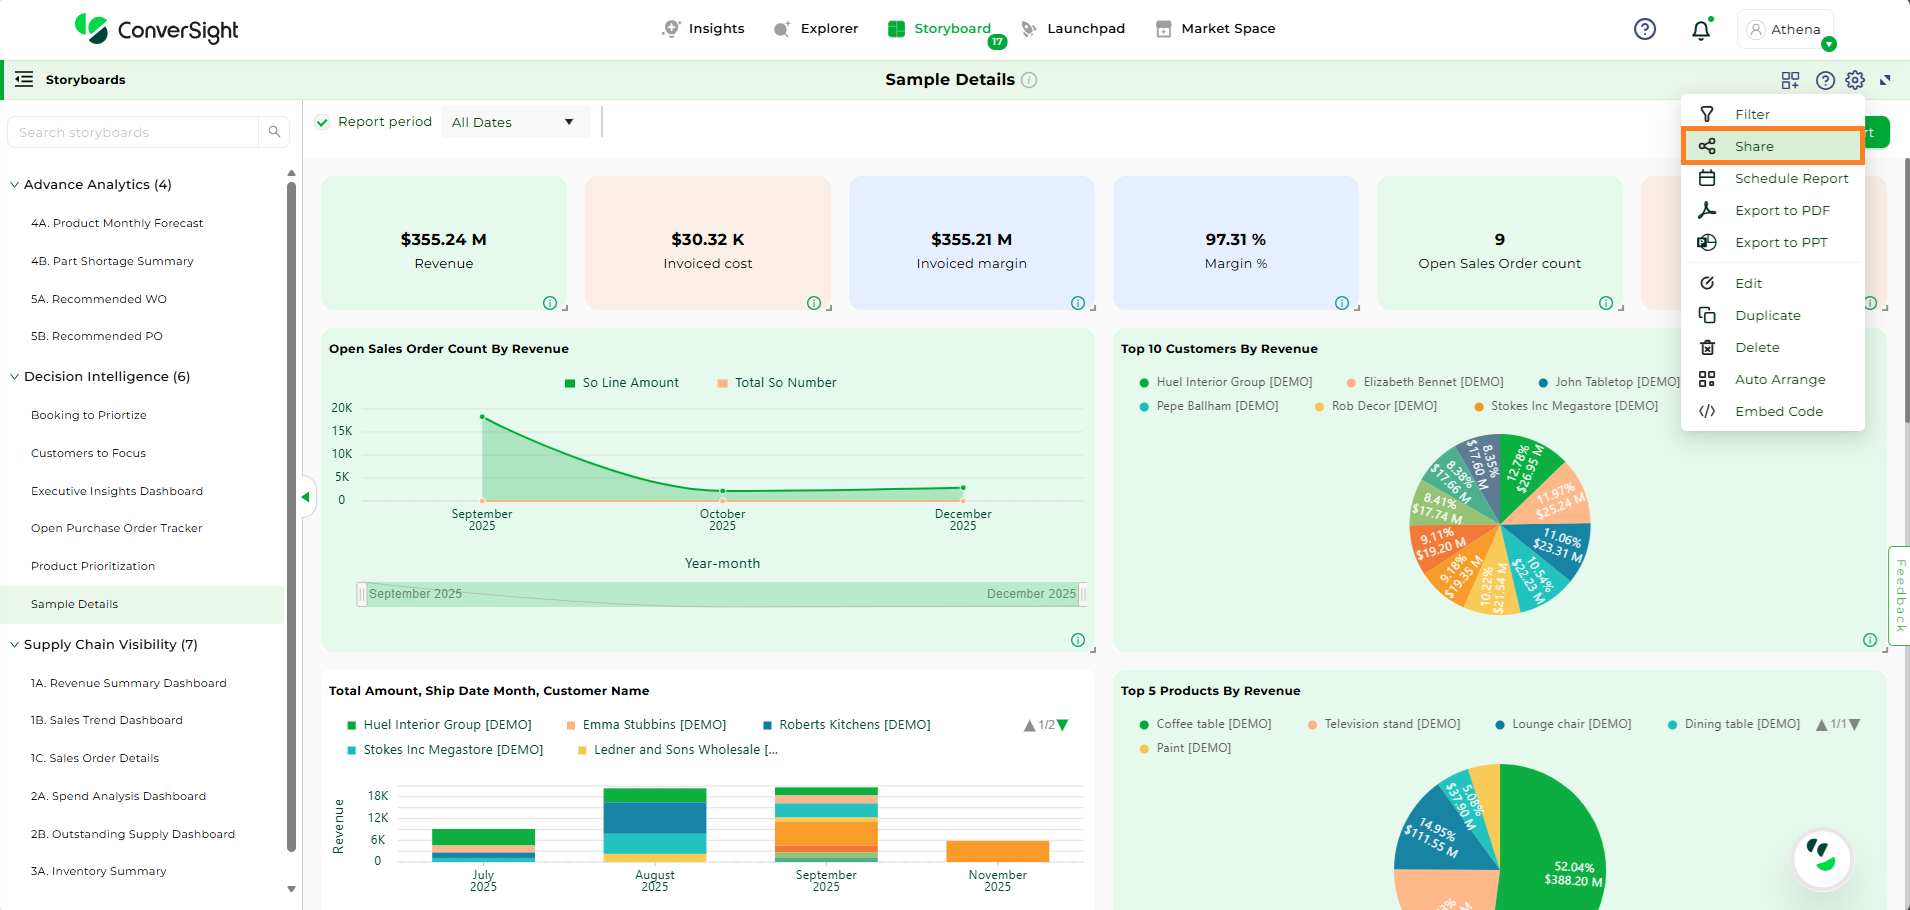
Share a Storyboard#
Select the user’s email address and you can share your selected Storyboard graph.
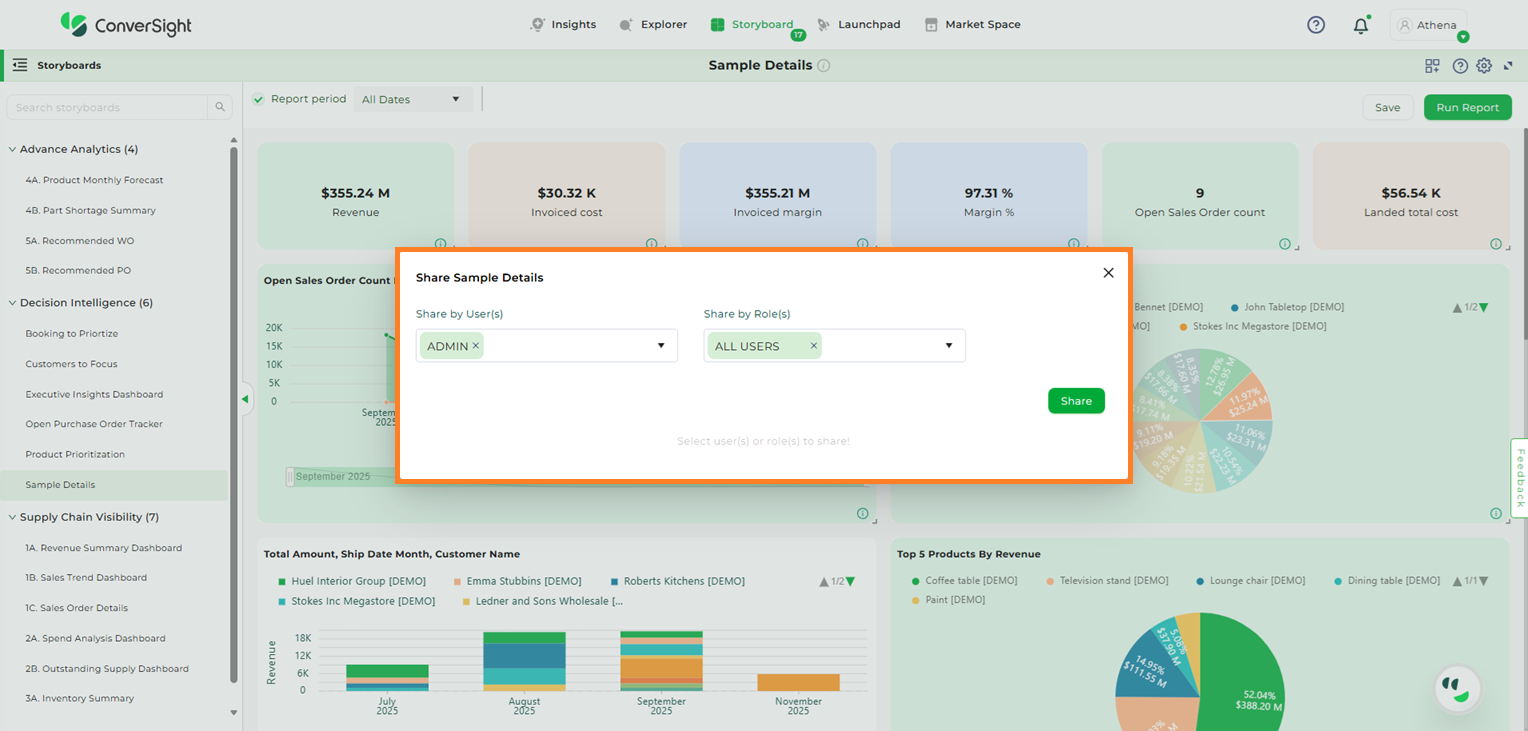
Share a Storyboard#
Schedule Report#
You can schedule a Storyboard job for any Storyboard. Click Settings icon and select the Schedule Report icon.

Schedule a Storyboard#
In the Scheduled Storyboard dialog box, you can add your email address as well as emails you would like to CC. You can set your schedule to daily or weekly and can also set your timings. Once you save your scheduled Storyboard, it will be sent to the recipient email with your set timings.
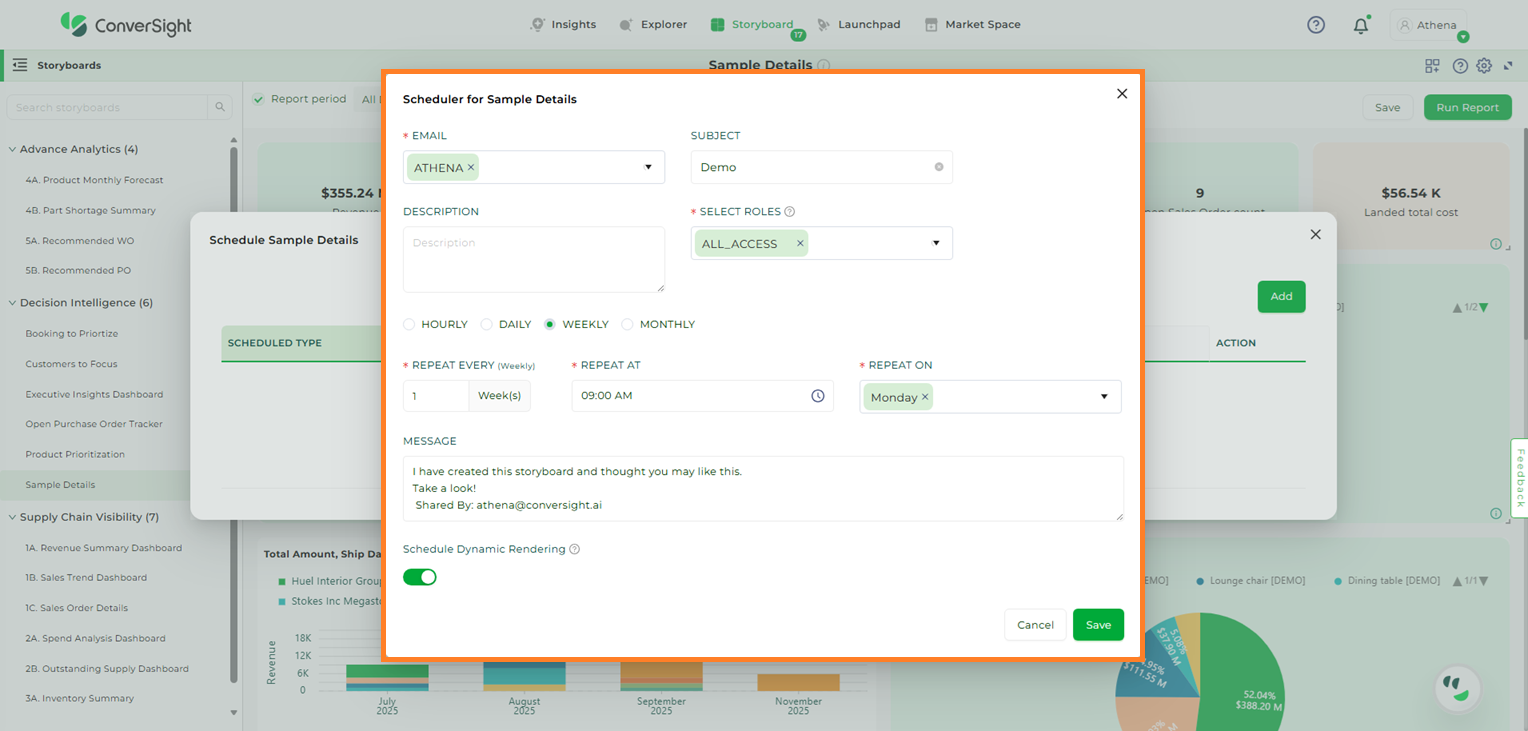
Schedule a Storyboard#
To watch the video, click on Scheduling Storyboard.
Export to PDF#
Click on Settings icon and select the Export to PDF option. In ConverSight, you can download the entire Storyboard in PDF format, so you can share it with people inside and outside your organization.
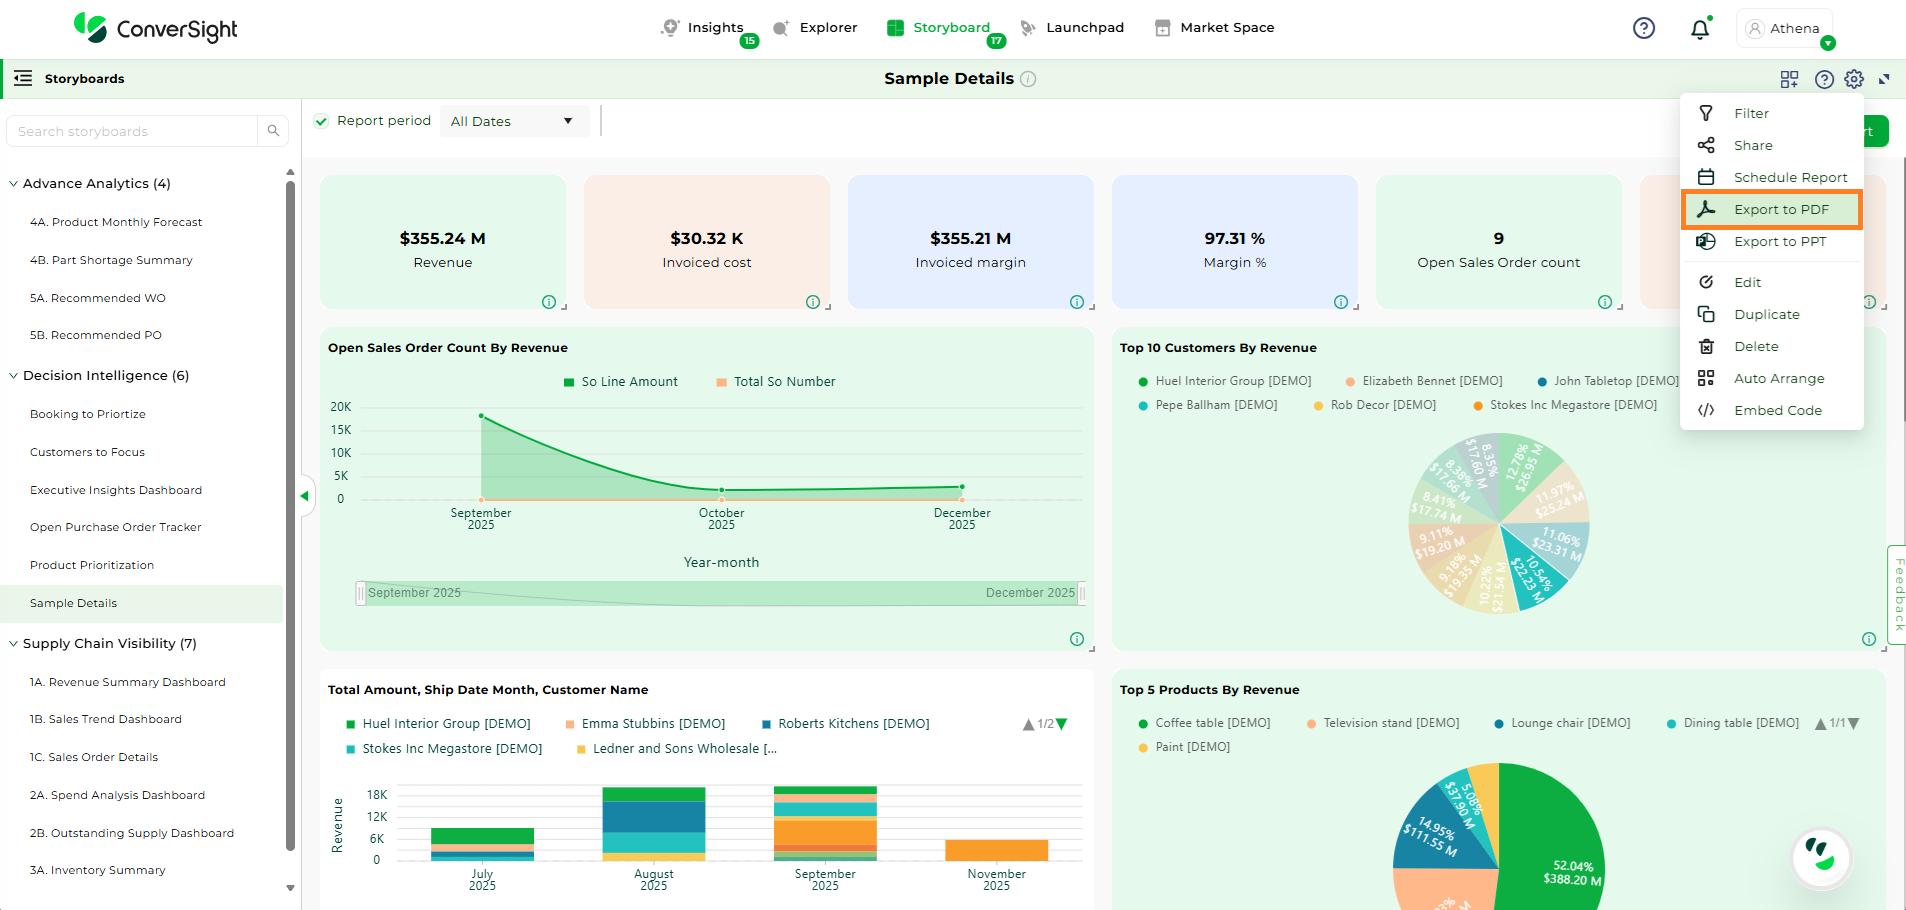
Export to PDF#
Export to PPT#
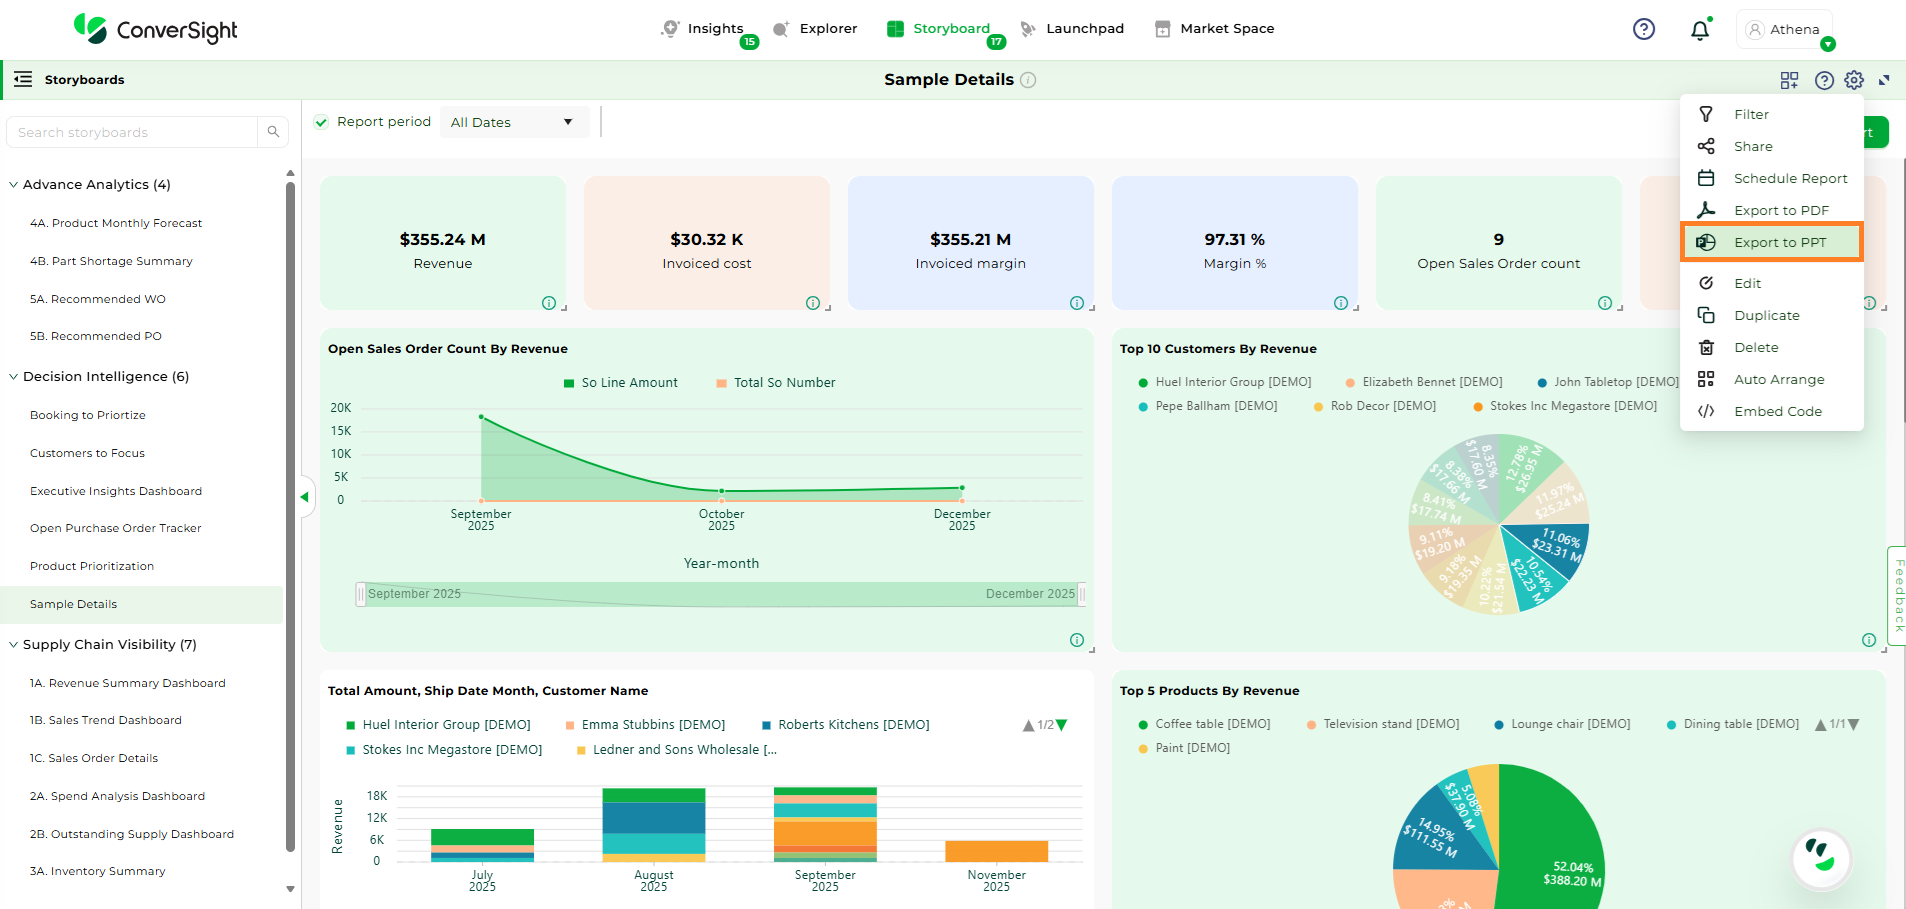
To generate a PowerPoint (PPT) version of your report, choose the specific storyboard and then click on the Export to PPT option. In ConverSight, you can download the entire Storyboard in PPT format, so you can share it with people inside and outside your organization.
Export to PDF#
Edit#
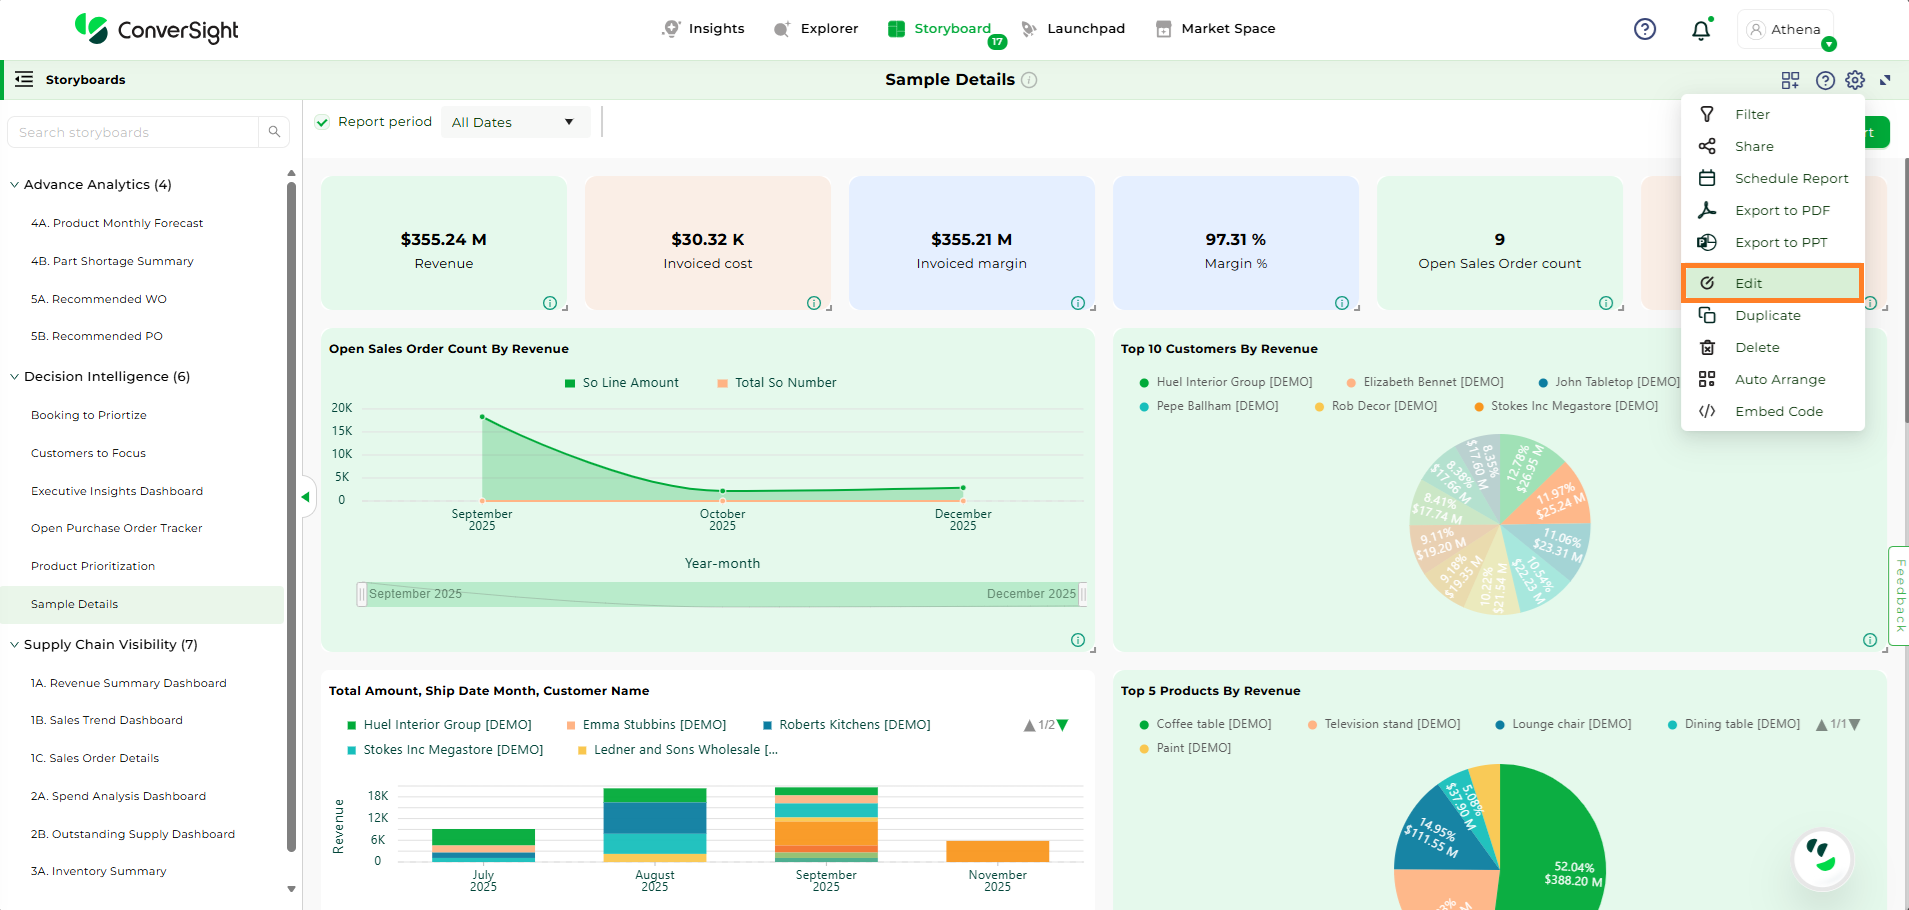
If you want to edit the original Storyboard, click on the settings icon and select Edit icon and you can change your Storyboard name.
Edit a Storyboard#
Edit a Storyboard#
Business Area to Storyboard#
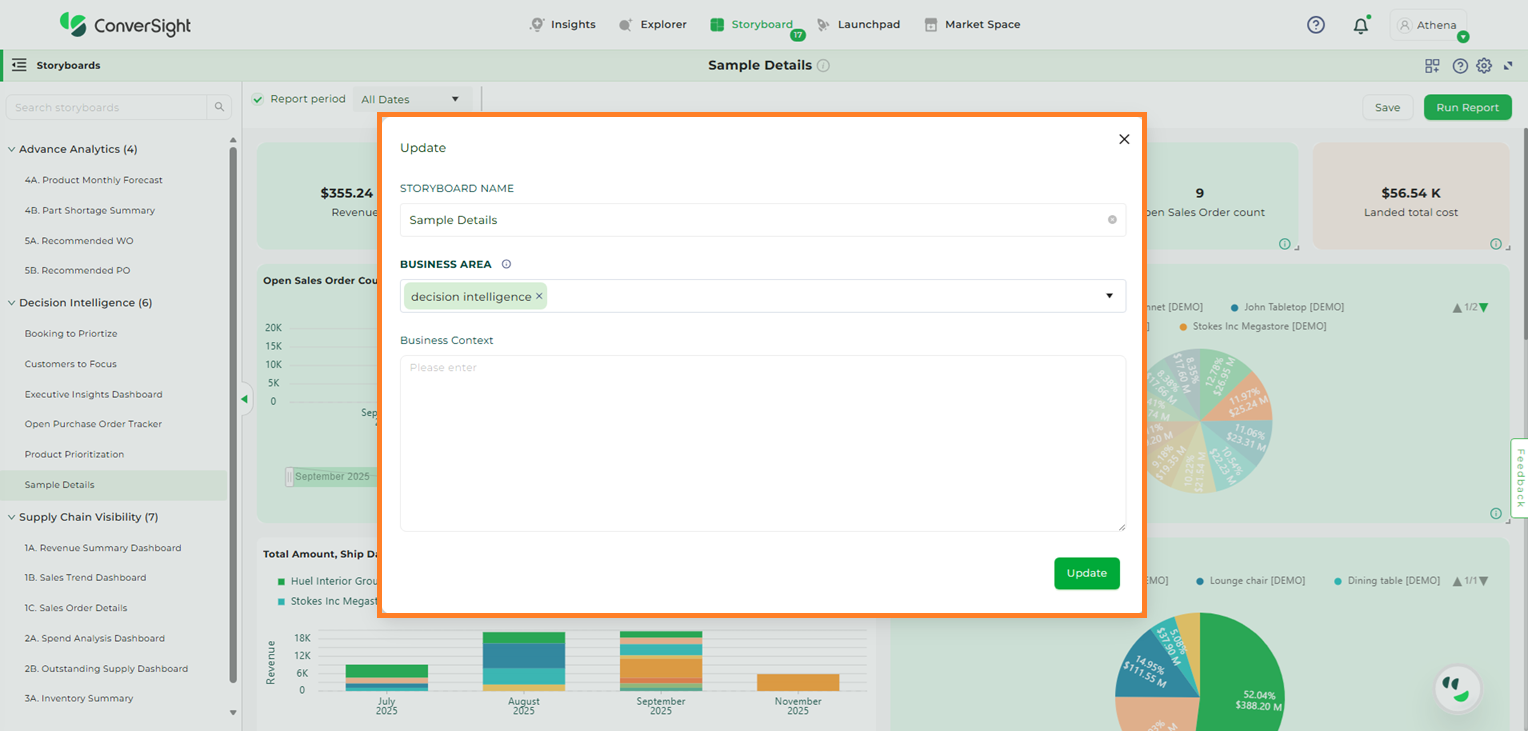
By clicking on the Edit icon, you can add a new Business Area to a storyboard. In addition to this, you can provide business context to give a clearer explanation. You can add more than one Business Area to the storyboard, allowing for a more detailed and organized presentation.
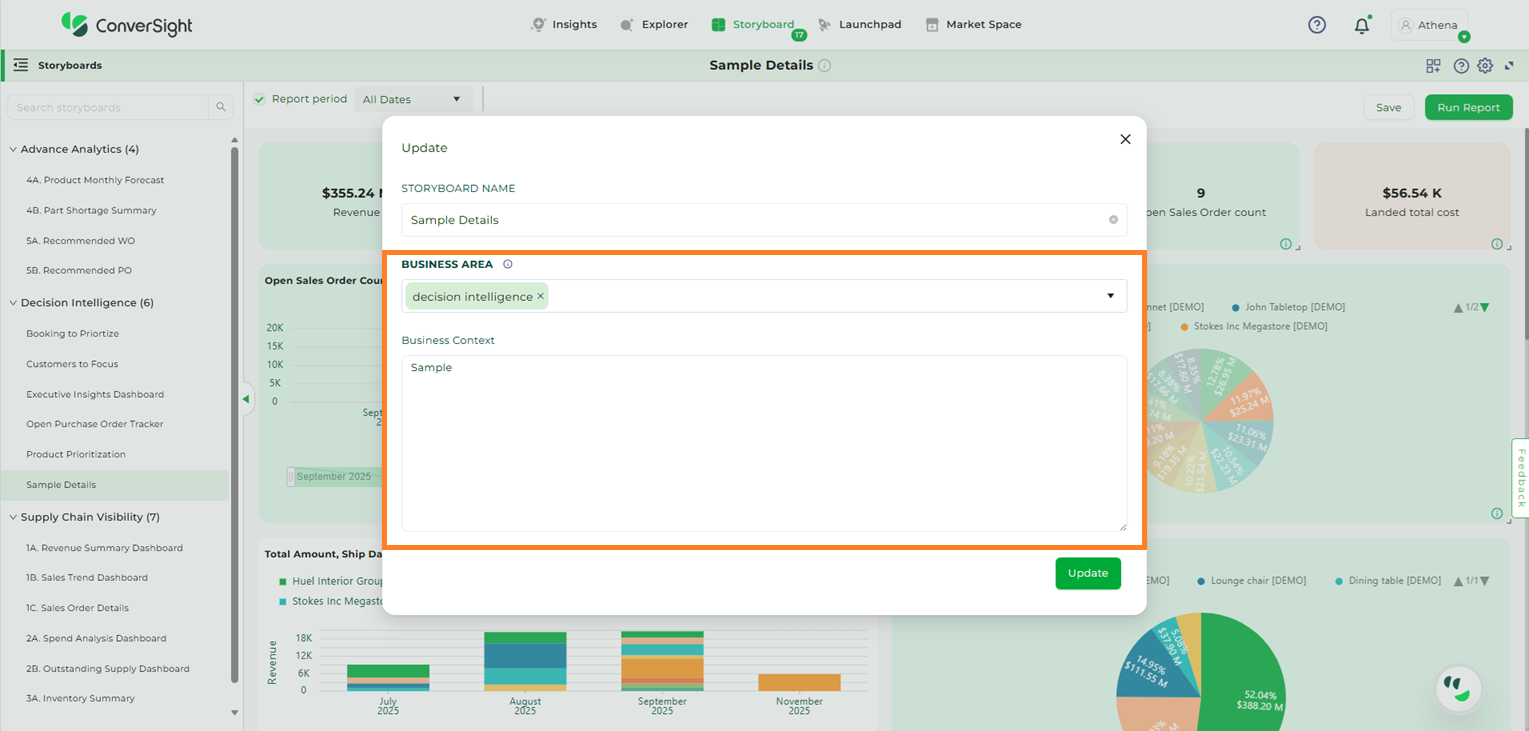
Add a Business Area#
Once you’ve made your additions, click the Update button to save and apply all the changes.
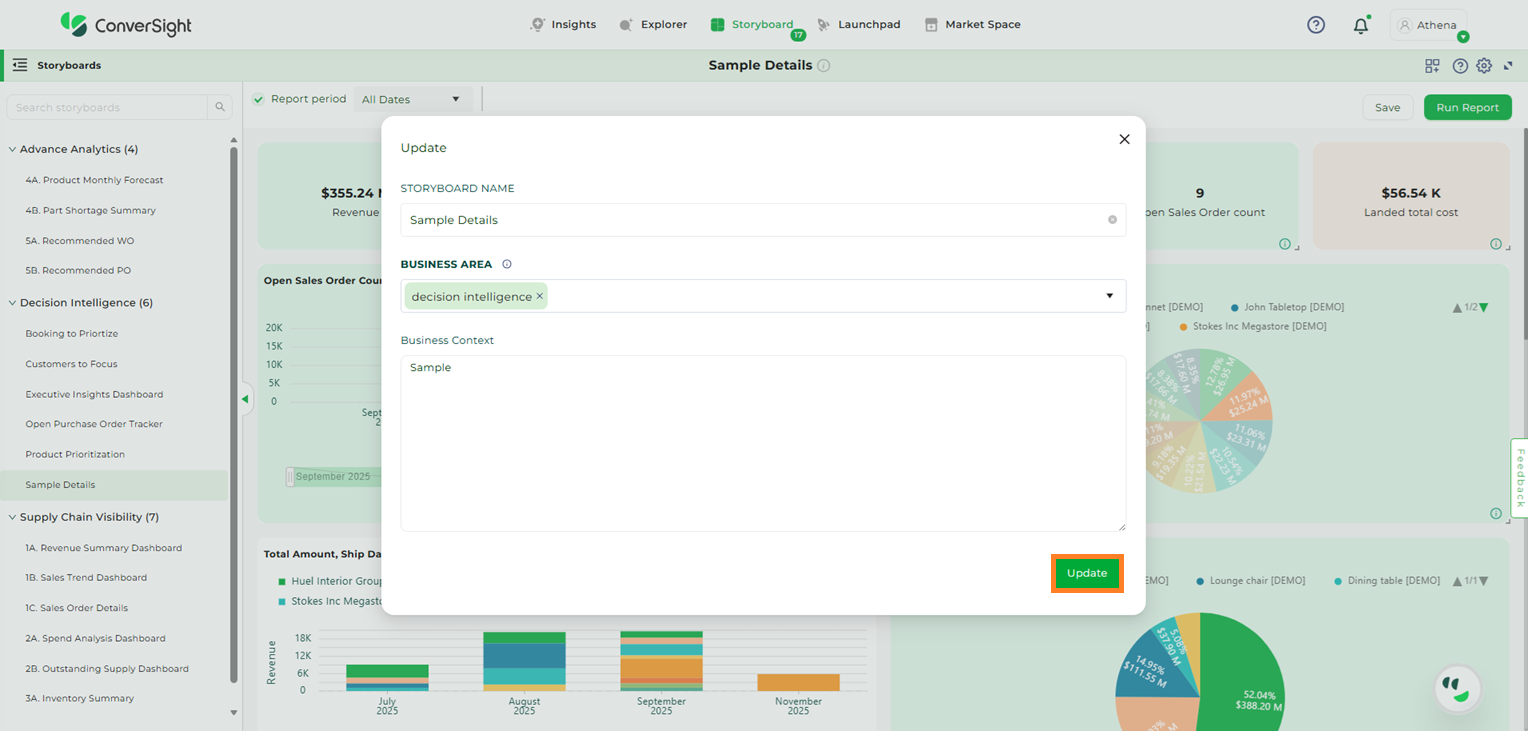
Update Button#
The added Business Area will be reflected in the List view in the left panel.
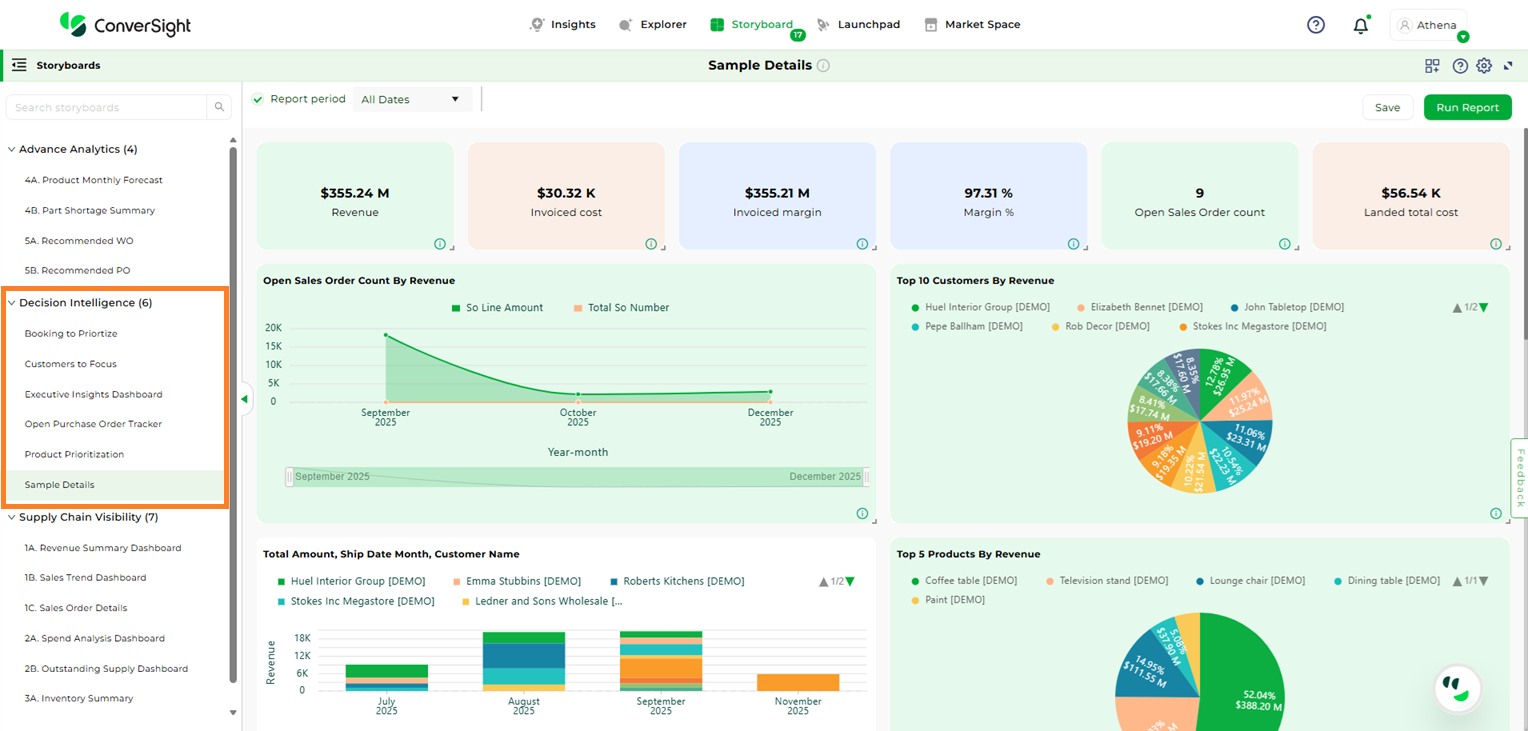
Updated Business Area#
Duplicate#
Click on the Settings icon and select Duplicate icon in the Storyboard page. Clone helps you in creating a copy of your Storyboard and edit it as required to create another Storyboard.
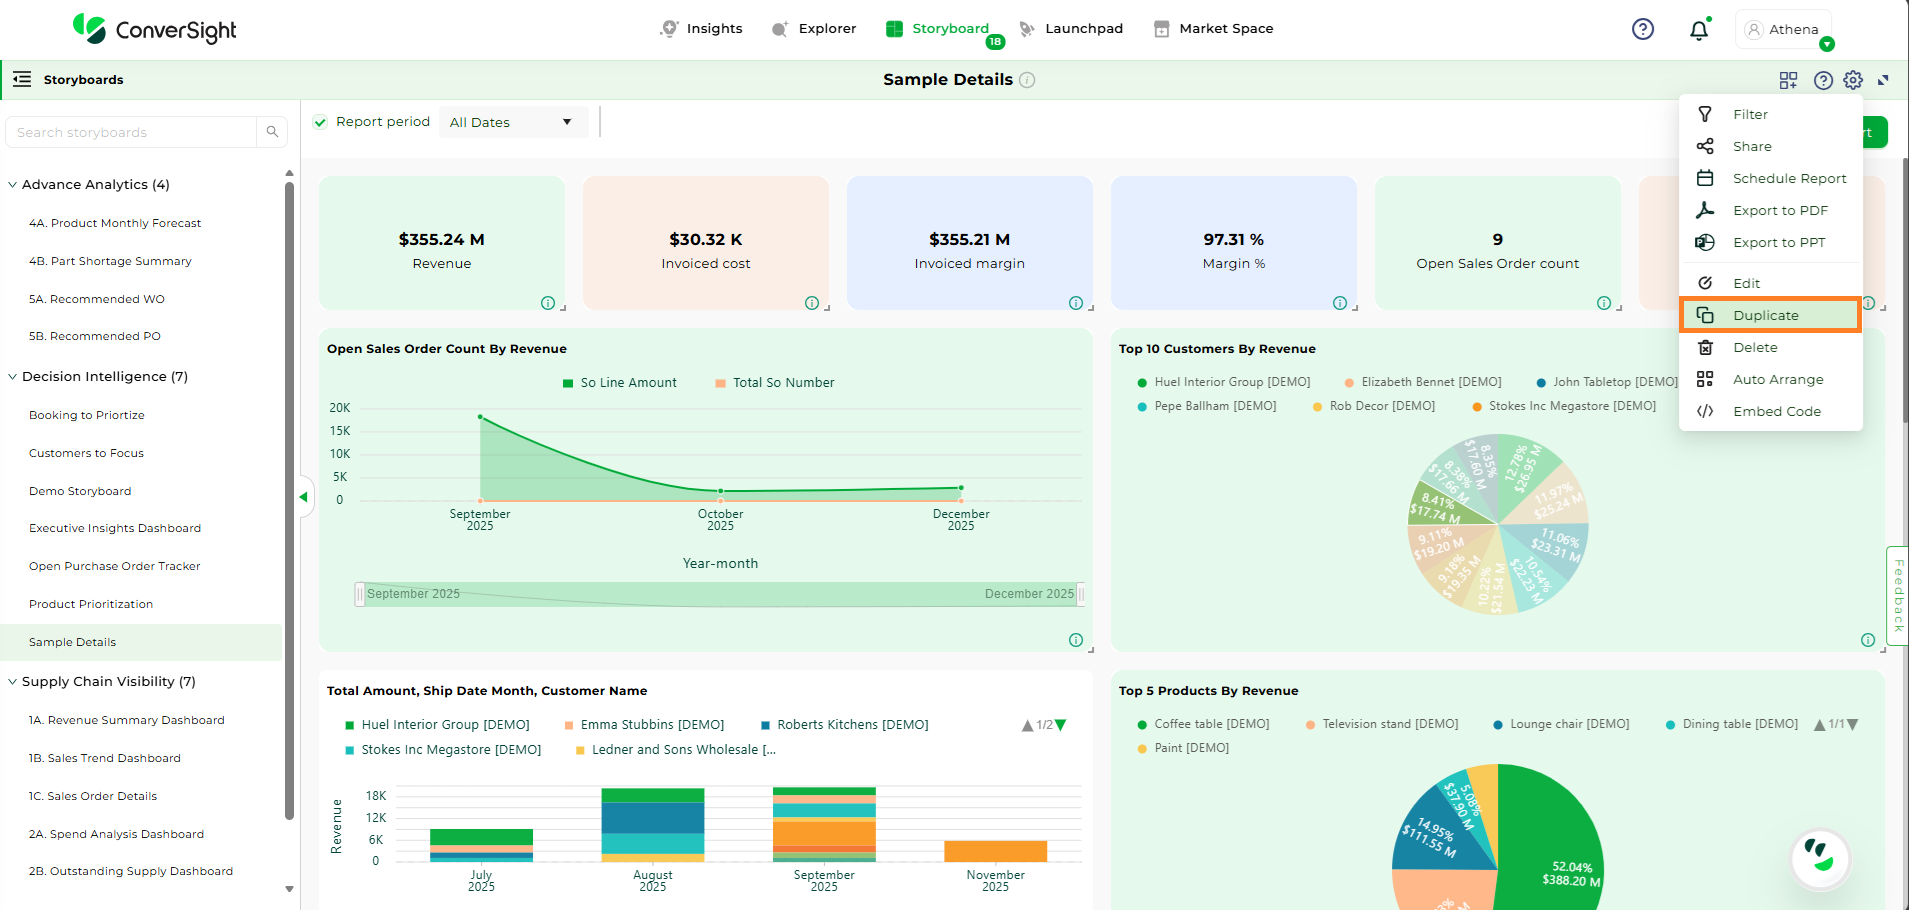
Duplicate a Storyboard#
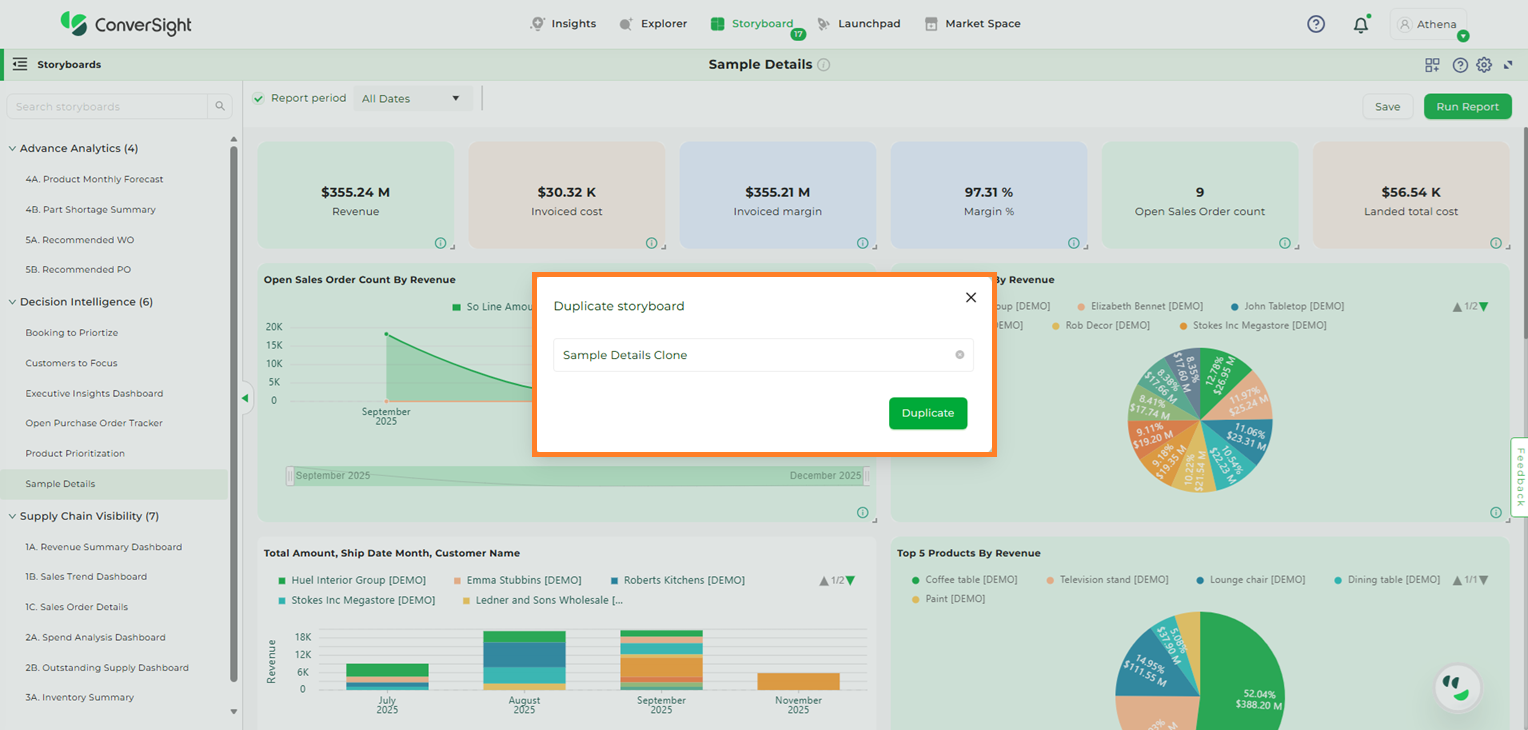
Duplicate a Storyboard#
Delete#
Click on Settings icon and select Delete icon, you can delete the selected Storyboard.
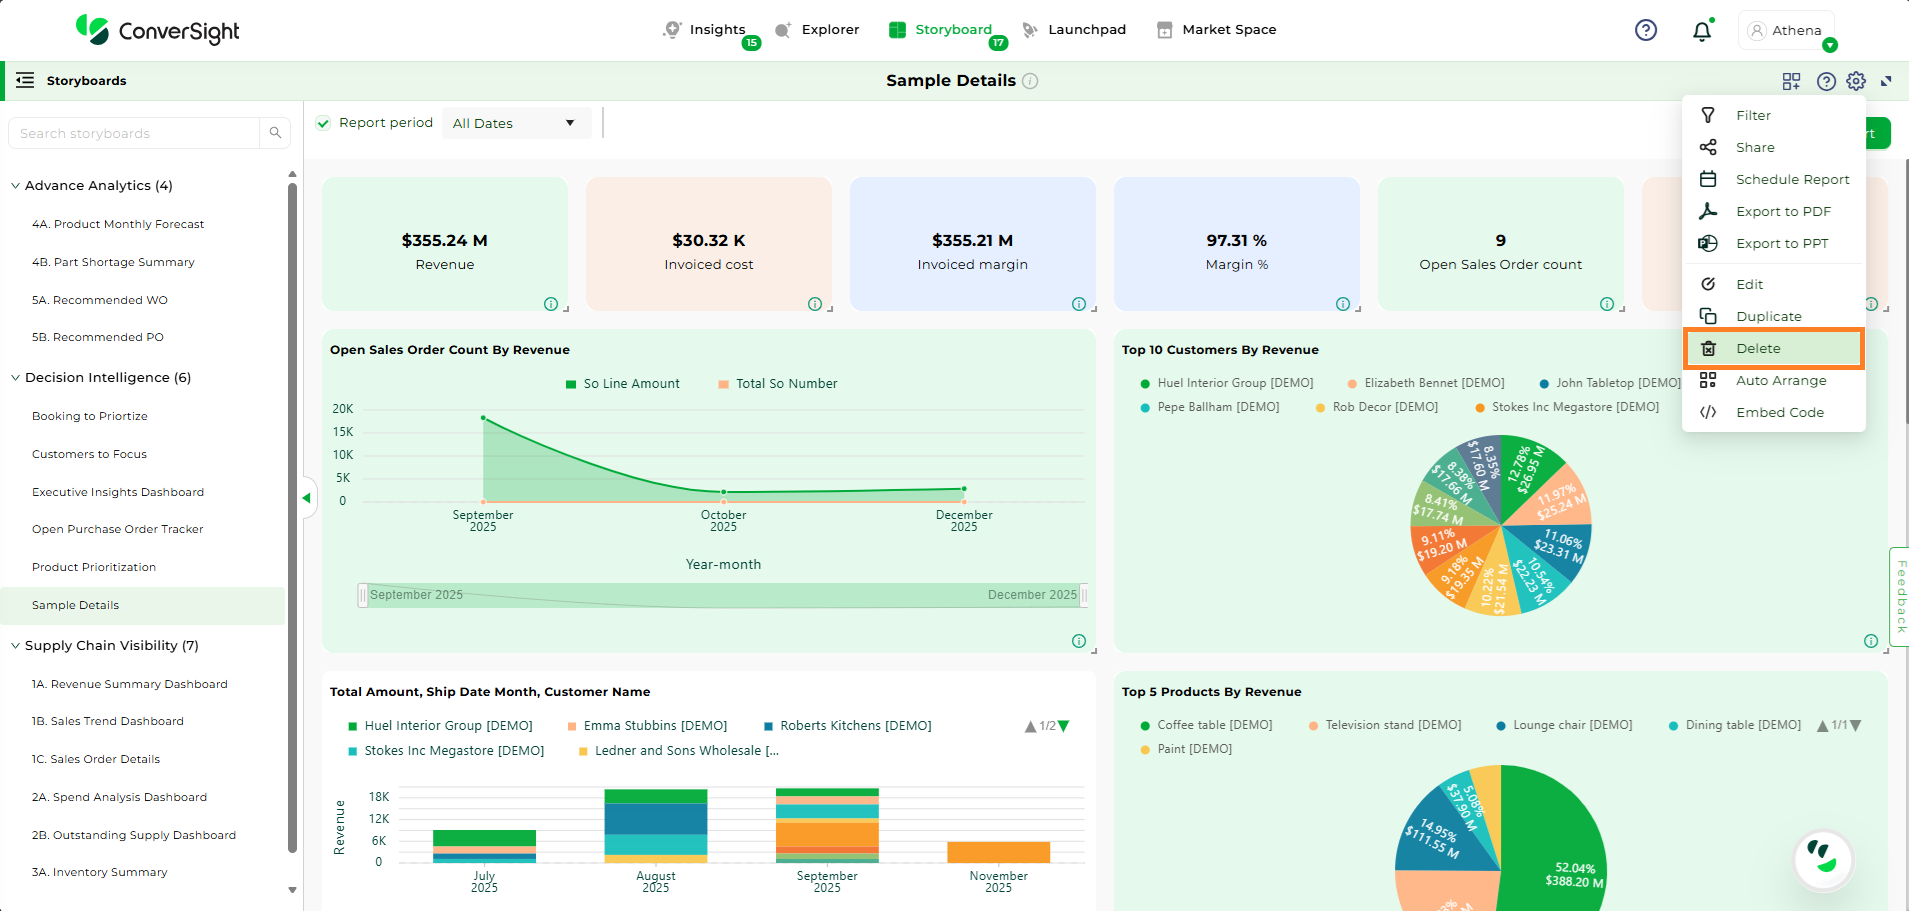
Delete a Storyboard#
When you click the Remove button, your selected Storyboard will be deleted.
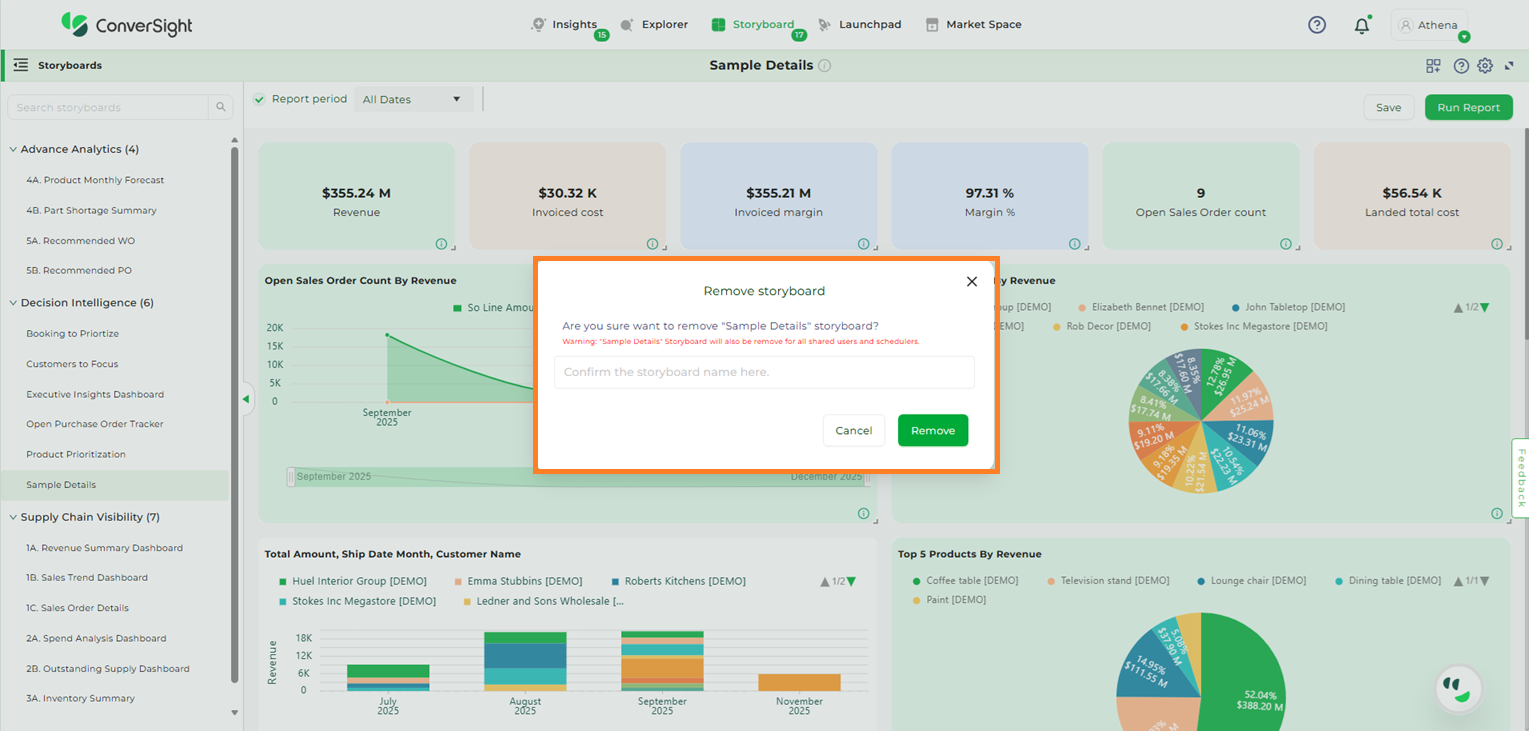
Delete a Storyboard#
Auto-Arrange#
Click on the Settings icon and select Auto-Arrange icon in the Storyboard page. This helps you in re-arranging your data or components in the Storyboard and gives you the best view by reducing free spaces.
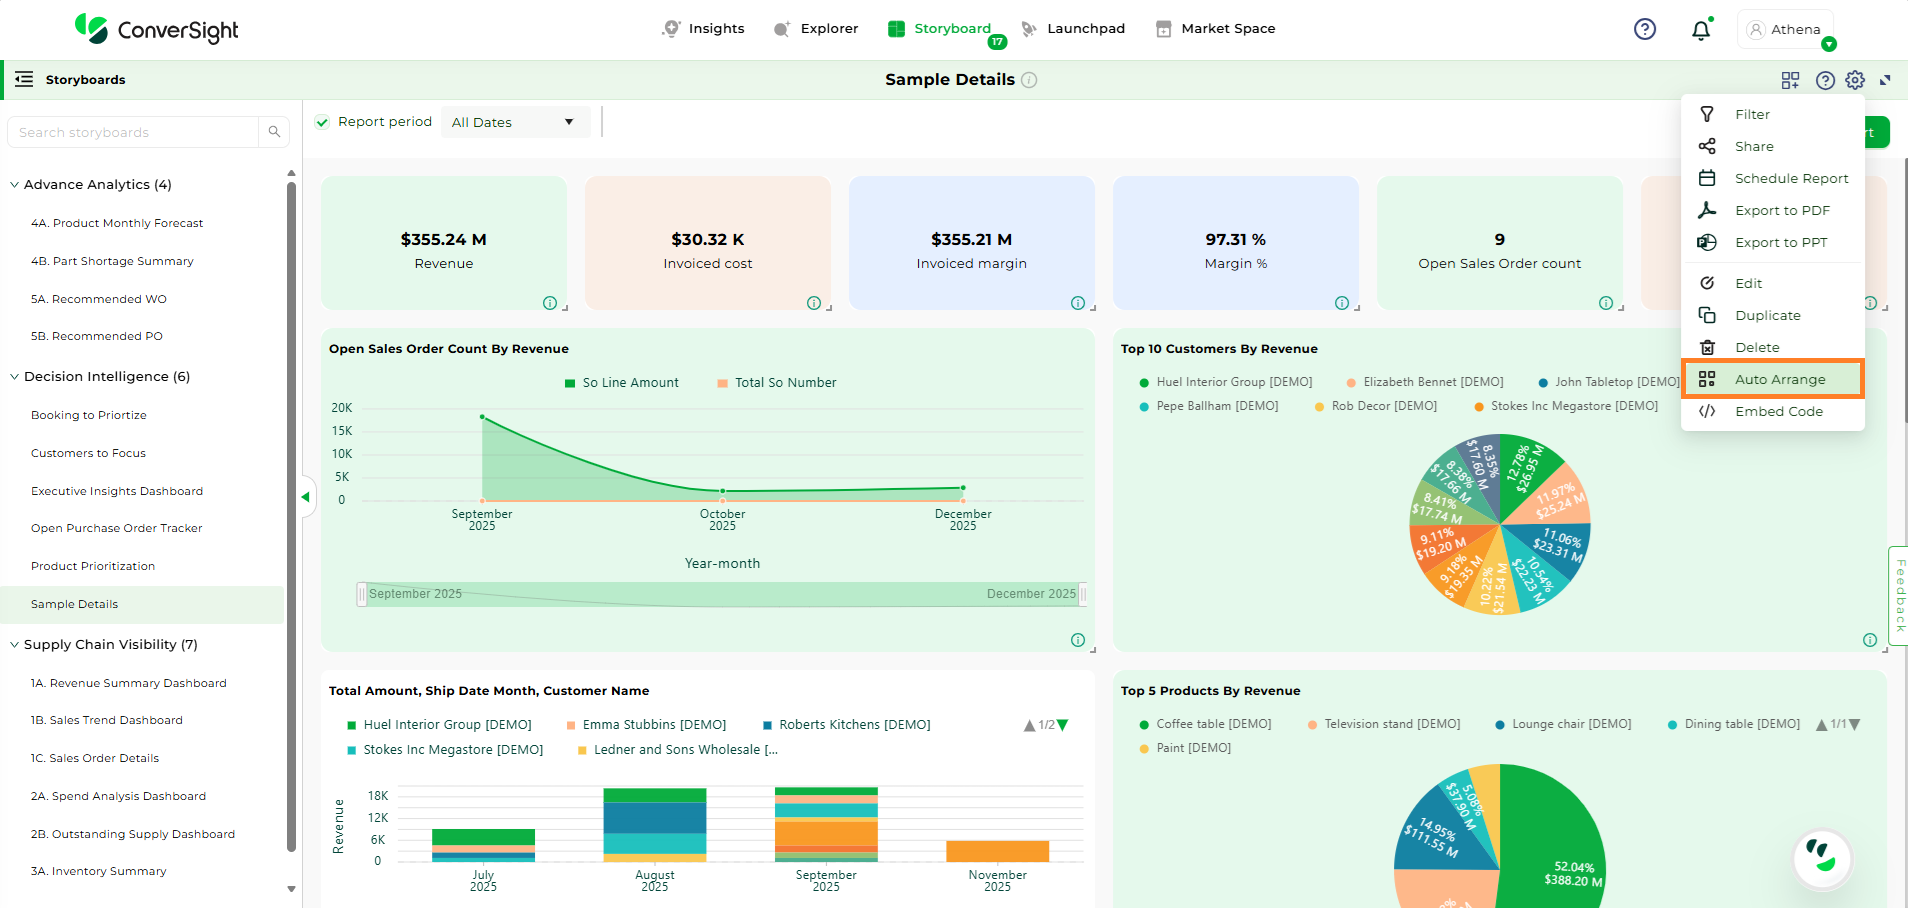
Auto Arrange a Storyboard#
Embed Code#
The Embed Code feature allows users to seamlessly integrate visual storyboards into internal or external applications. This enables users to access real-time insights directly within their own applications, without needing to log into the ConverSight platform. Organizations can apply filters and permissions to ensure that each embedded storyboard is securely tailored to the intended audience, making it easier to deliver data-driven narratives across departments or client-facing portals.
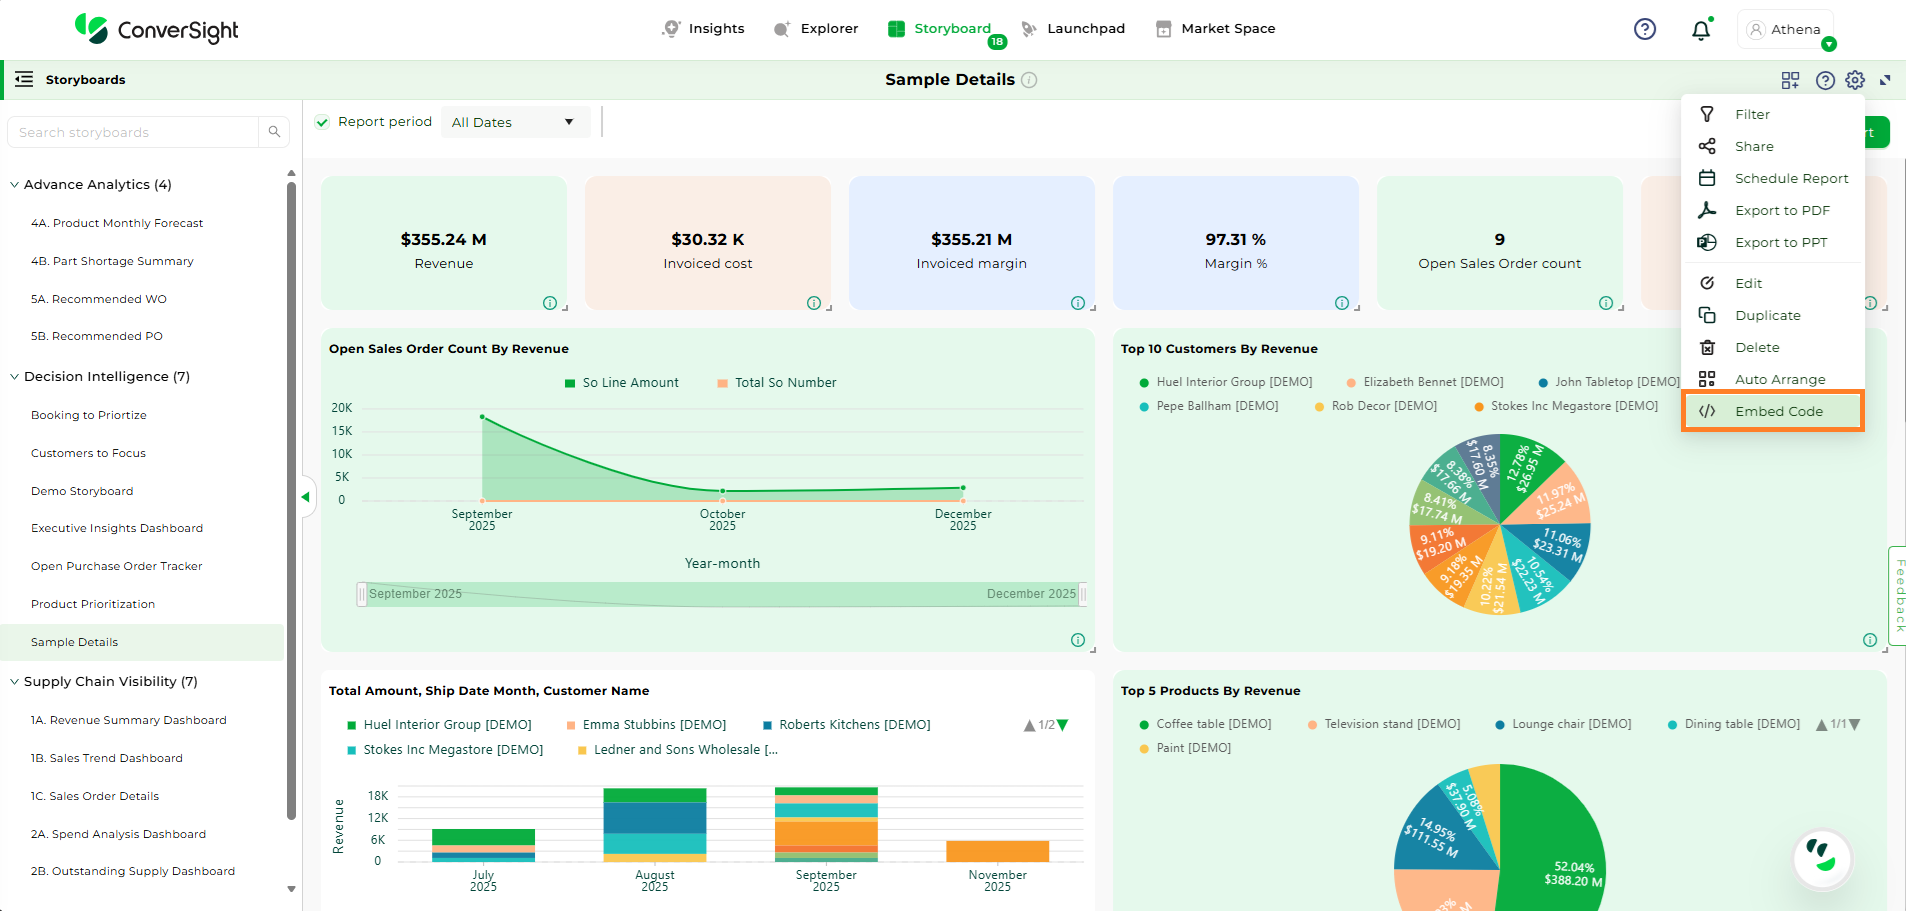
Embed Storyboard#
To watch the video, click on Embedding a Storyboard
To learn more in detail refer Embedding a Storyboard
Auto Refresh Storyboard#
Automatically refreshes all queries in the storyboard at defined intervals, ensuring the displayed data remains up to date without manual intervention.
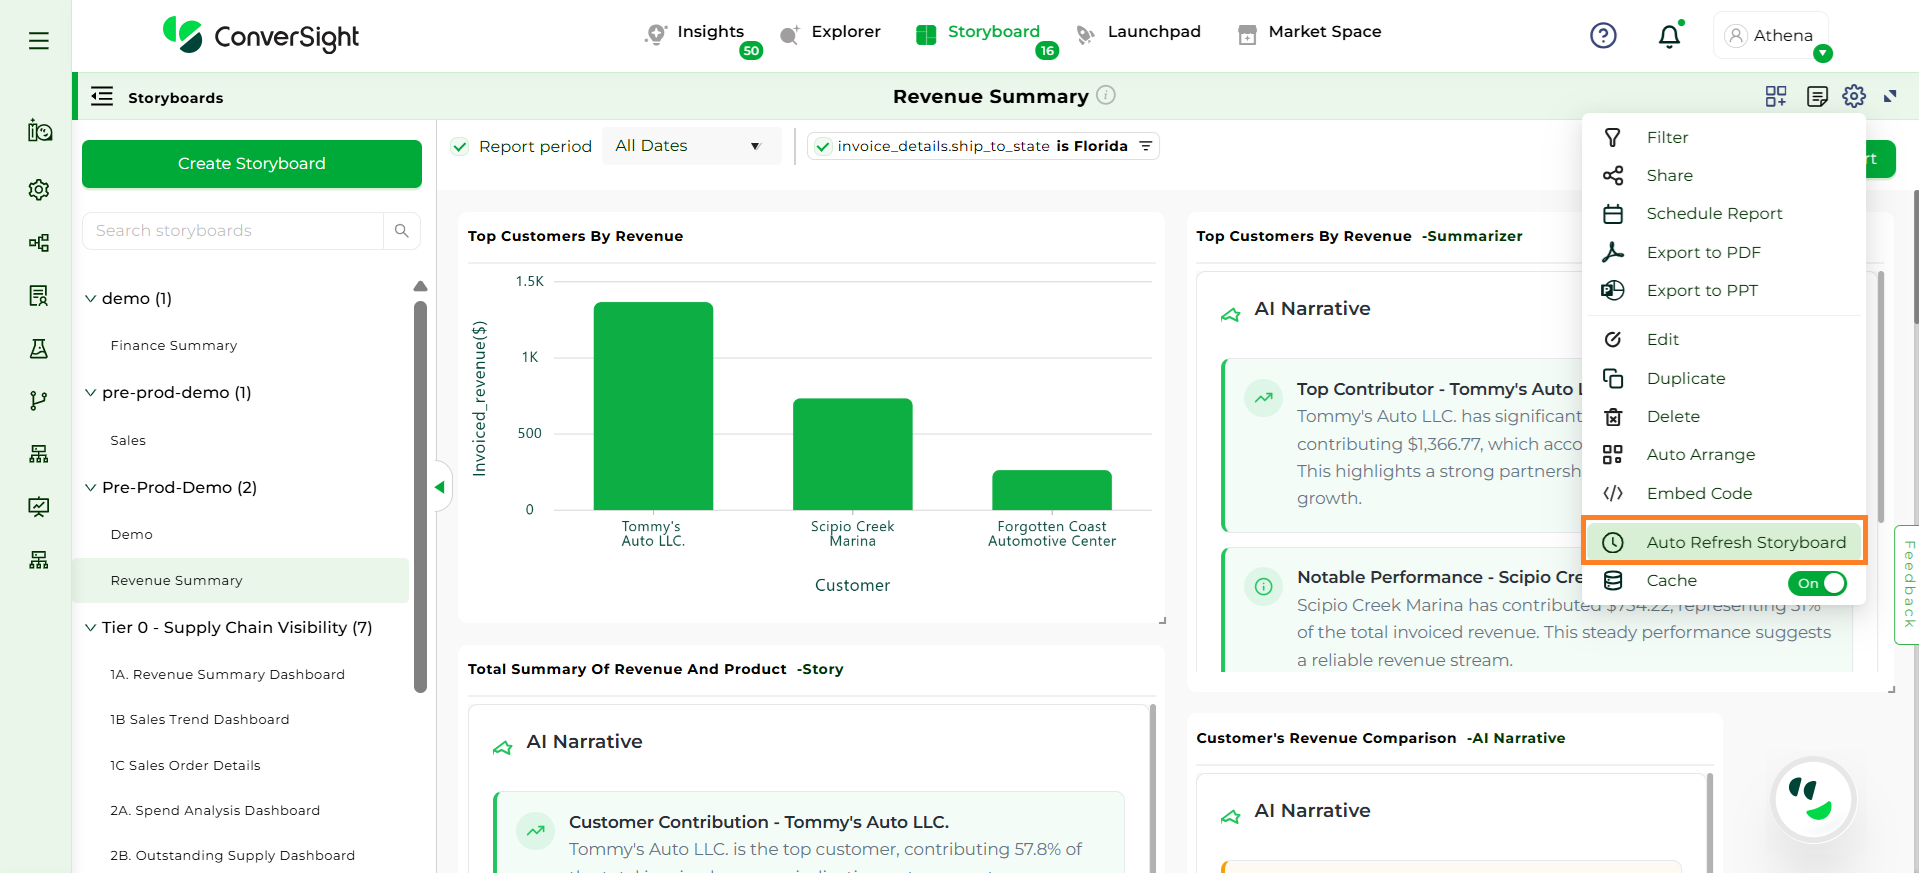
Auto Refresh#
Cache#
Cache stores previously retrieved query results to improve performance and reduce load times. When the toggle is enabled, the system reuses cached data instead of re-running queries, allowing storyboards to load faster while maintaining consistent results.
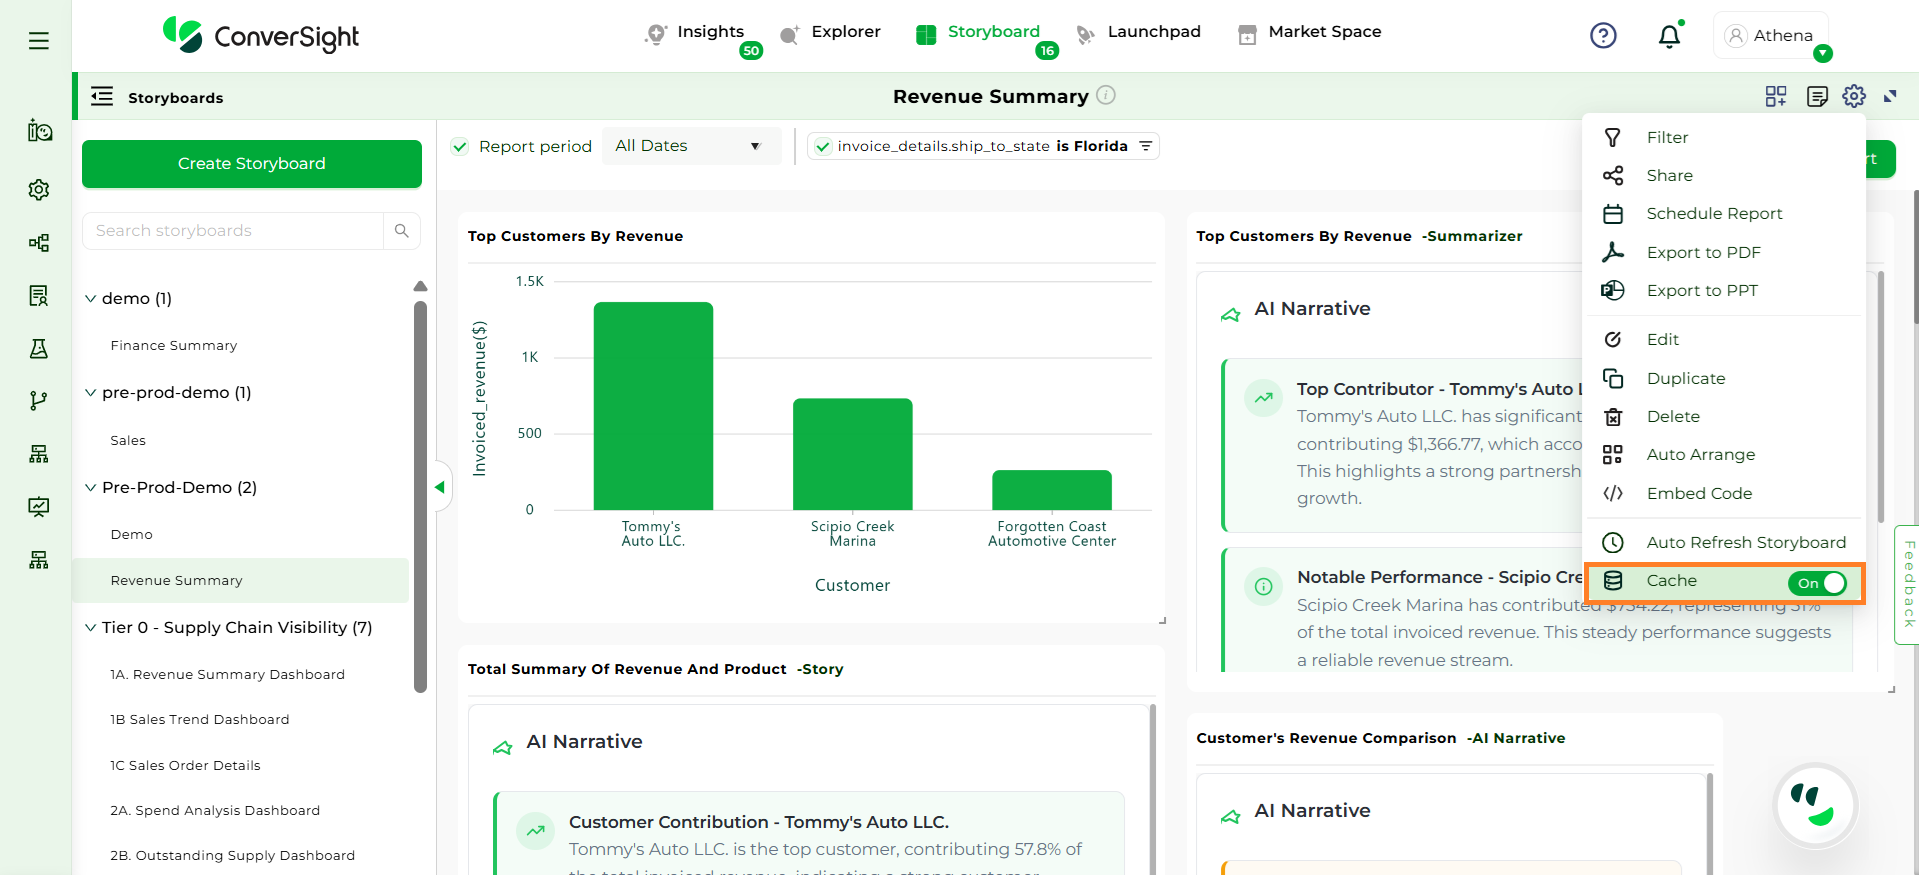
Cache#
Linking a Storyboard#
The Navigate to feature in the Storyboard enables you to establish connections from your Storyboard to other elements like apps, insights, another Storyboard or even a designated URL of your choice.
Now let's look at the steps to link a Storyboard:
Step 1: Switch to the Storyboards page from the Insights page.
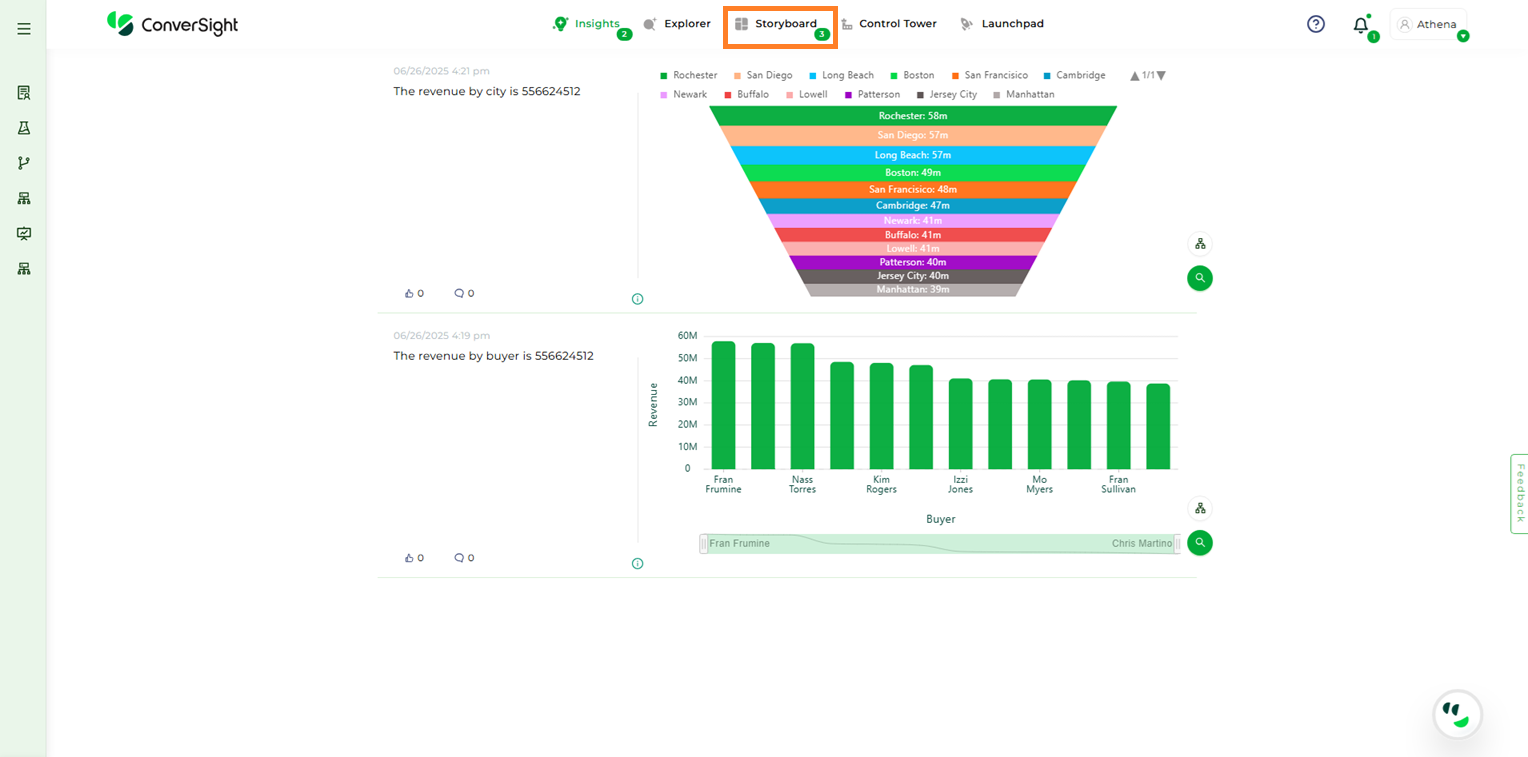
Storyboard#
Step 2: Select the preferred Storyboard to connect with other elements.
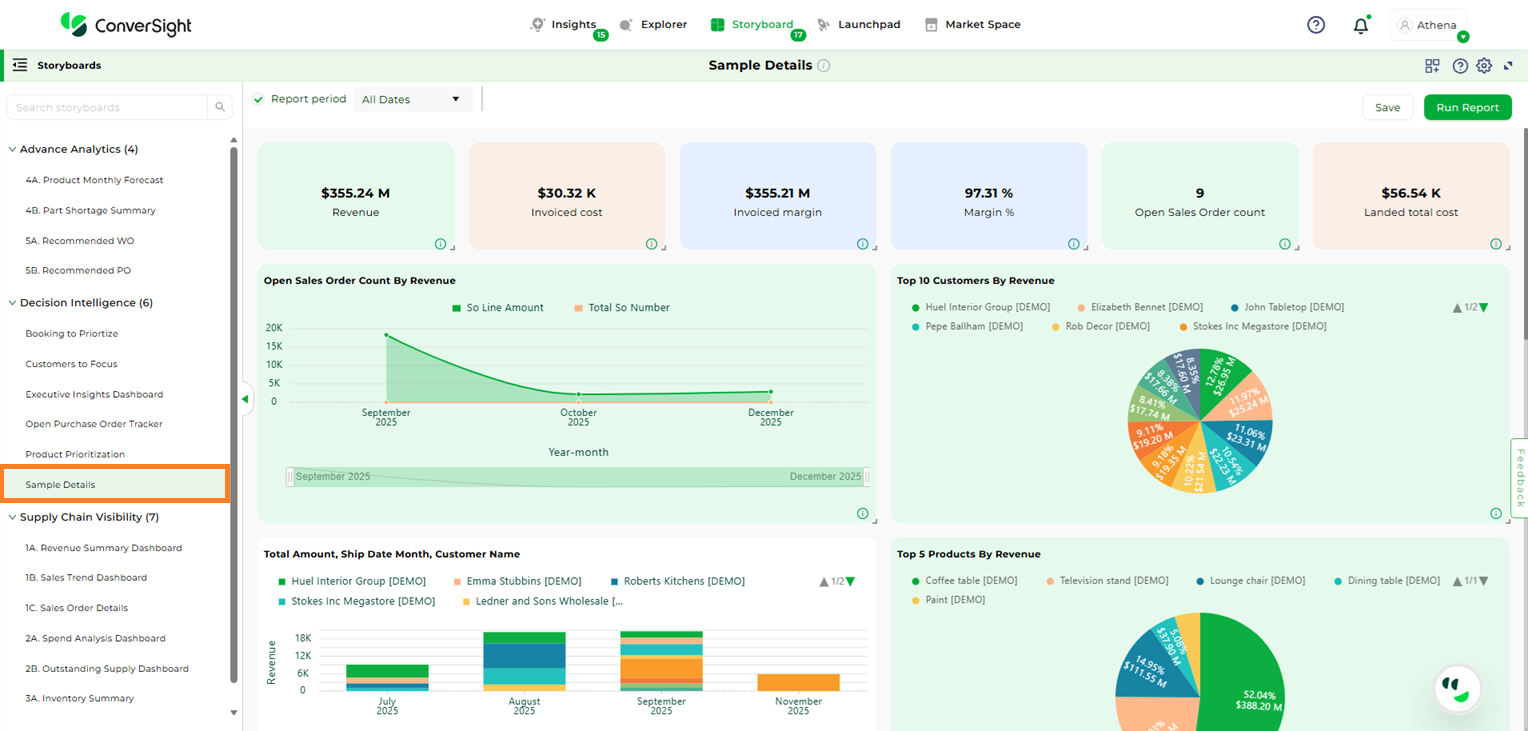
Storyboard#
Step 3: Click on the desired Insight’s title to create a connection with other elements and to edit the title of the Insight.
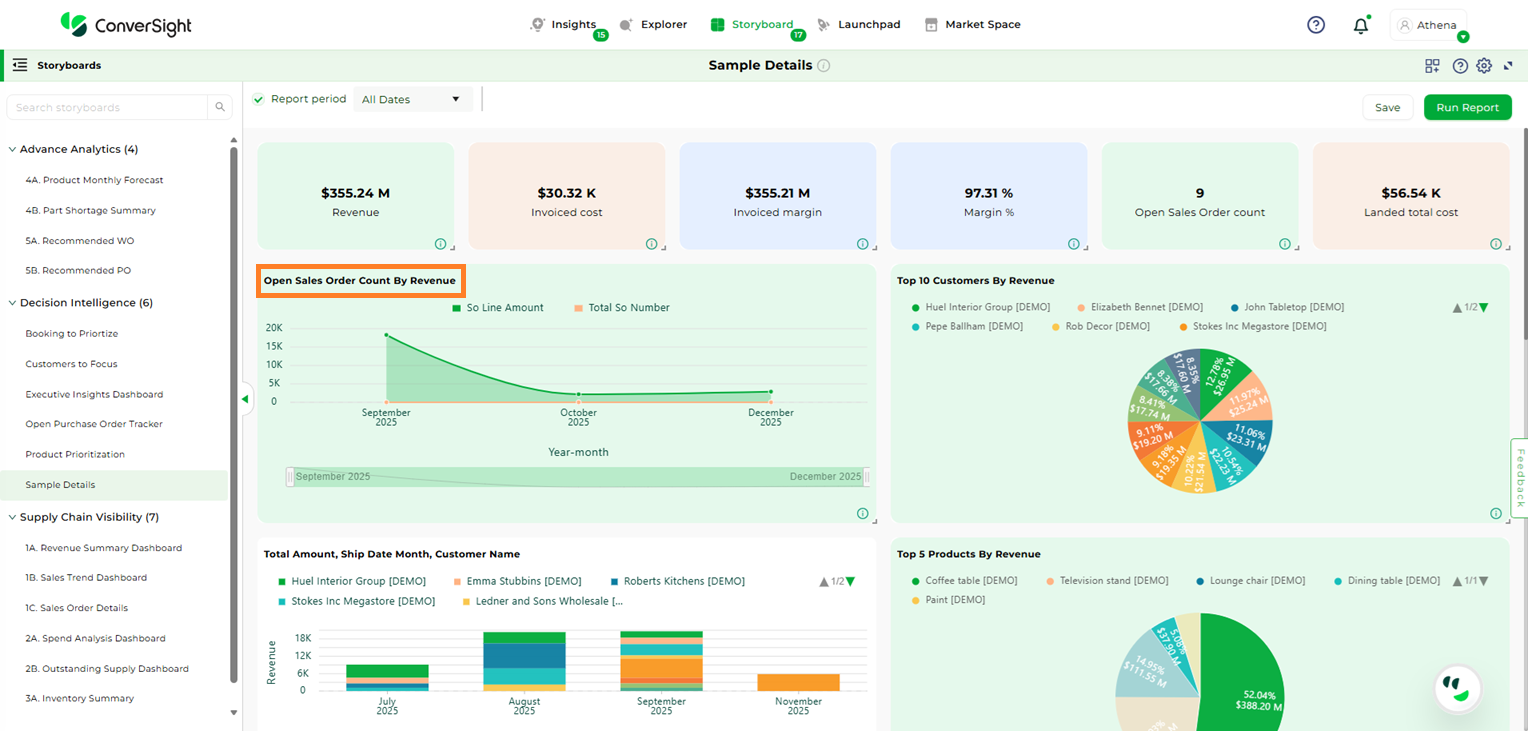
Insight Title#
Step 4: In the Navigation to dropdown, choose your Storyboard’s redirection destination which are Apps, Insights, Storyboard or URL.
When you choose Apps, you can create a link between your Storyboard and a preferred CS App. Clicking the Storyboard’s title will then redirect you to the selected CS App.
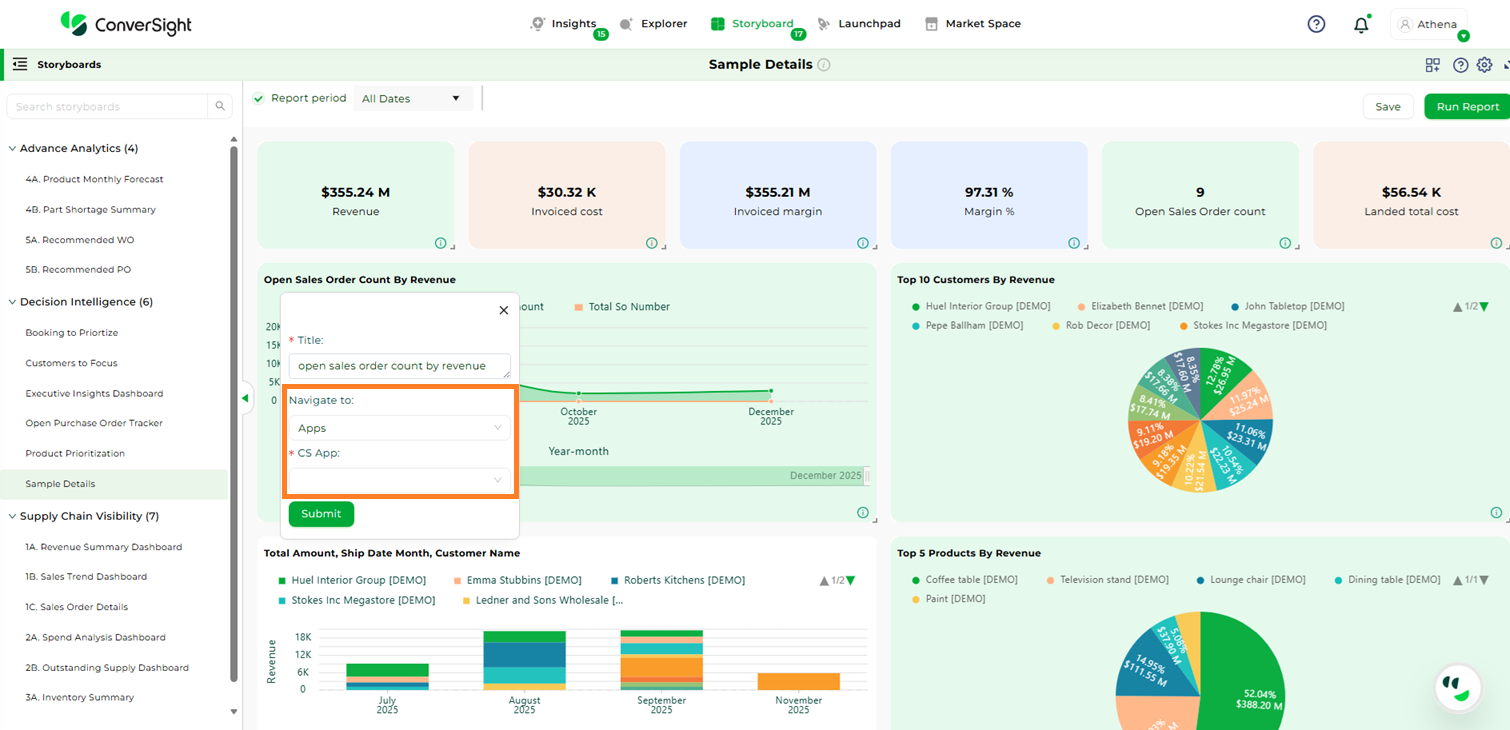
Navigate to Apps#
If you select Insights, you can establish a connection between the Storyboard and the Insights page. Clicking the Storyboard’s title will then direct you to the Insights page.
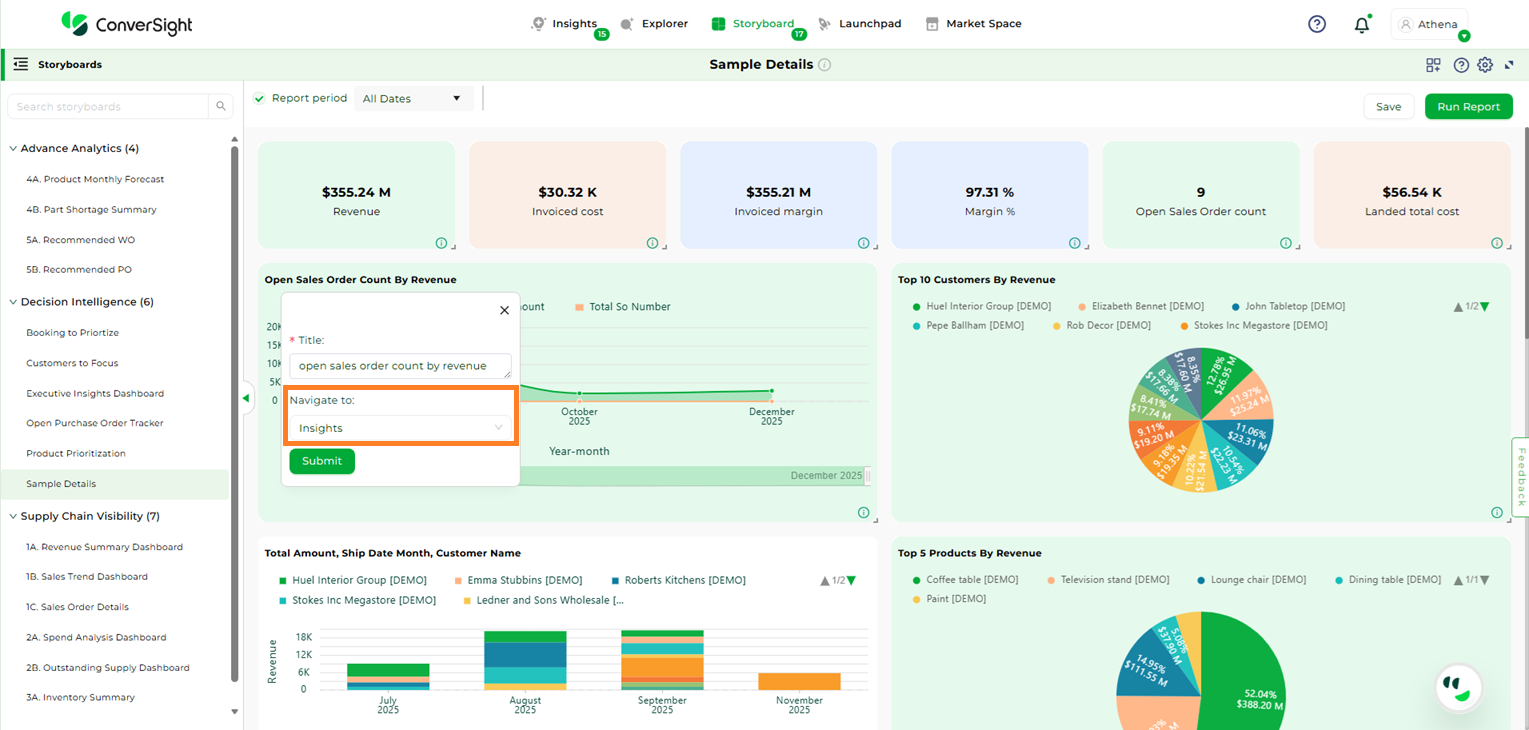
Navigate to Insights#
Opting for the Storyboard option allows you to establish a link to a pinned item within a Storyboard of your choice. When you click on the Storyboard’s title, it will lead you to the pinned Insight on the selected Storyboard’s page.
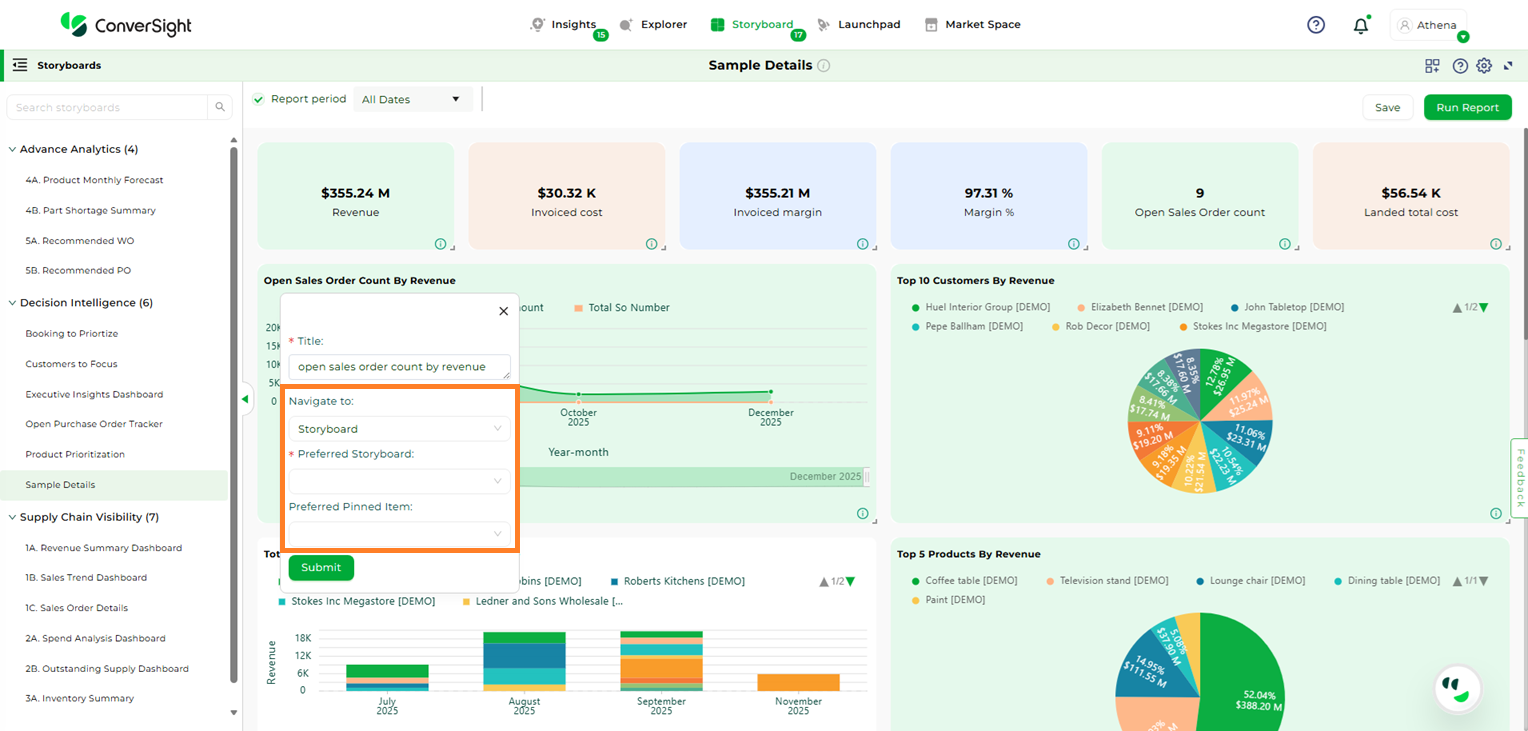
Navigate to Storyboard#
If you choose URL , you have the option to establish a link between your Storyboard and an external website by inputting the URL. Clicking on the Storyboard’s title will then take you to the specified link. If you check the Open in a new tab checkbox, the link will open in a new browser tab.
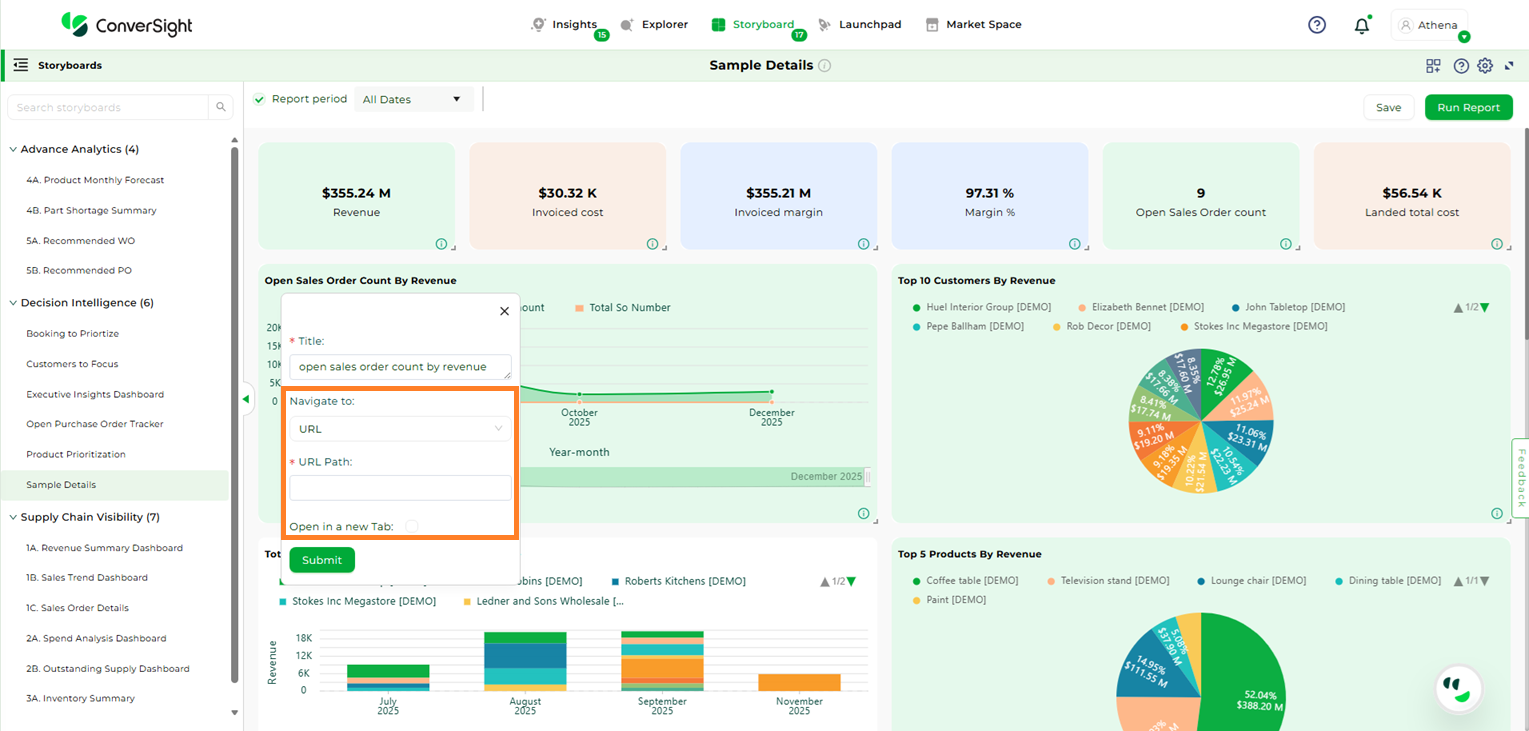
Navigate to URL#
Step 5: After making your selection for the Storyboard’s redirection destination, click the Submit button.
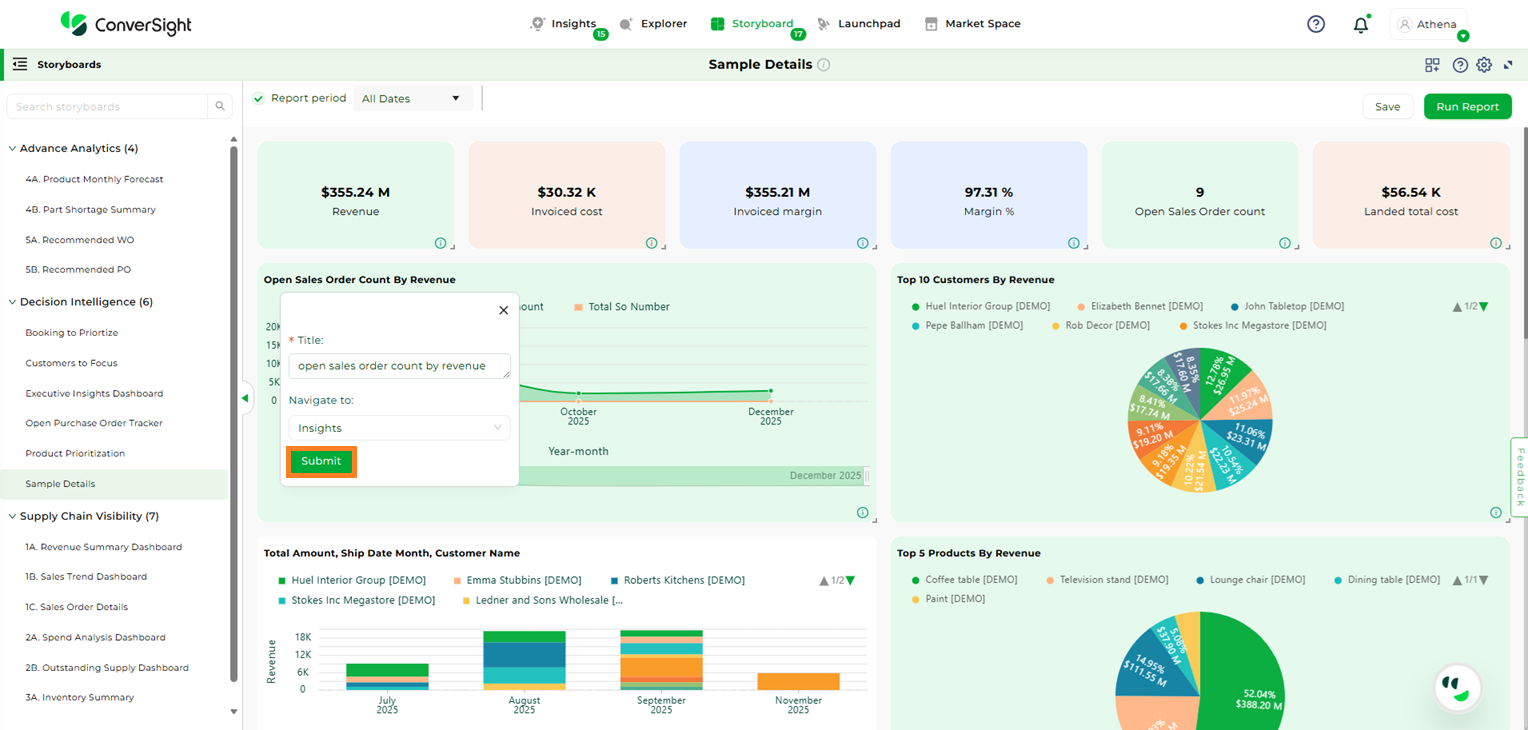
Submit#
Once the link is established, the Storyboard title will convert into a hyperlink, rendering it clickable. Upon clicking the title, the Storyboard will redirect to the selected destination. This navigation feature within Storyboards is also accessible to users within the organization with whom the storyboard has been shared.
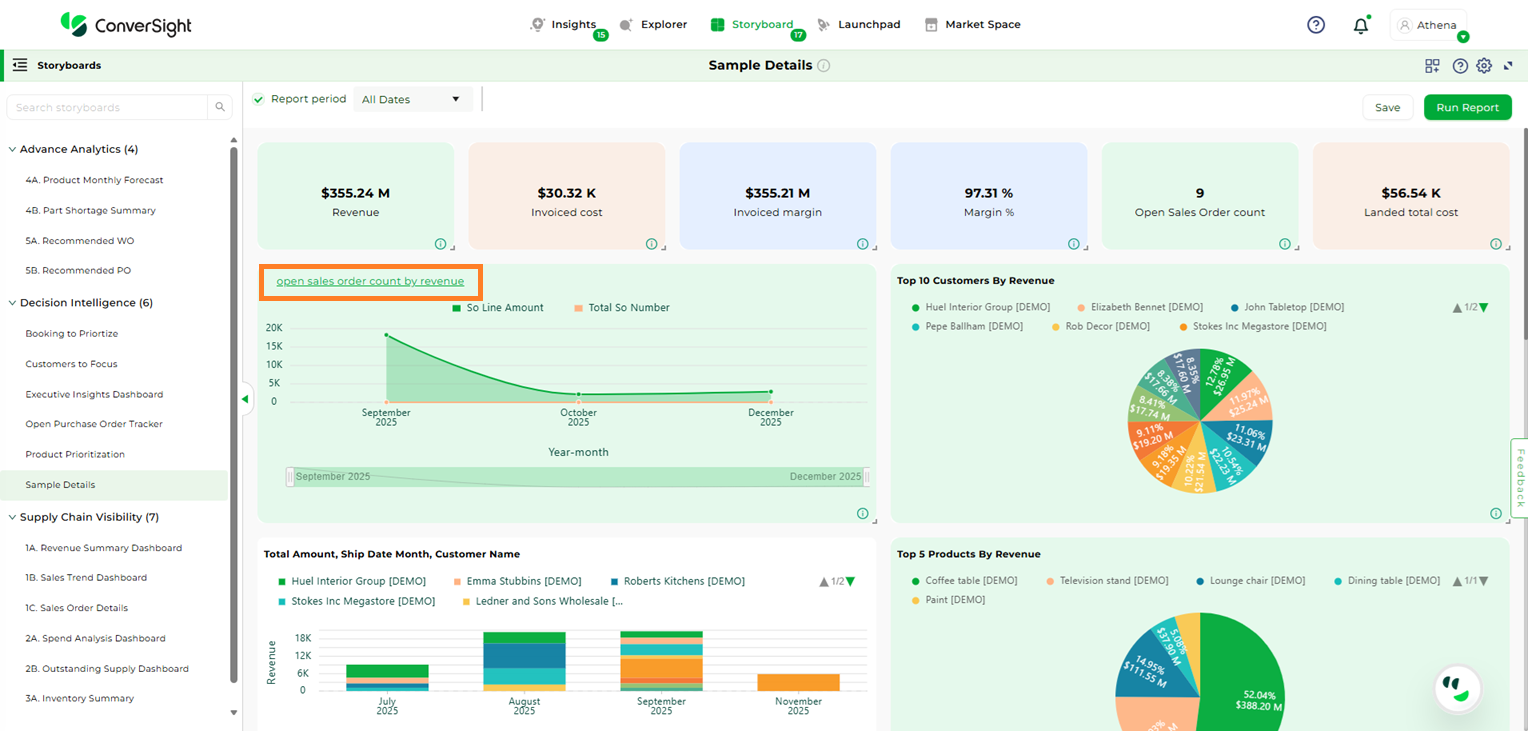
Linked Storyboard#
In conclusion, a Storyboard is your personalized canvas for data visualization and organization. It empowers you to effortlessly compile, access and showcase your charts, graphs and insights in a single, cohesive space. In a world inundated with data, Storyboards offer clarity and convenience, ensuring that your most critical insights are always at your fingertips, ready to inform and guide your decisions.