Period Analysis#
Period Analysis helps you compare metrics across different time intervals to identify trends and changes in performance over time. You can configure comparisons by using period-over-period and by choosing a frequency that fits your analysis needs.
Follow the steps below to run a Period Analysis Query:
Step 1: Navigate to the Explorer page and click on the Period Analysis option available in the query panel.
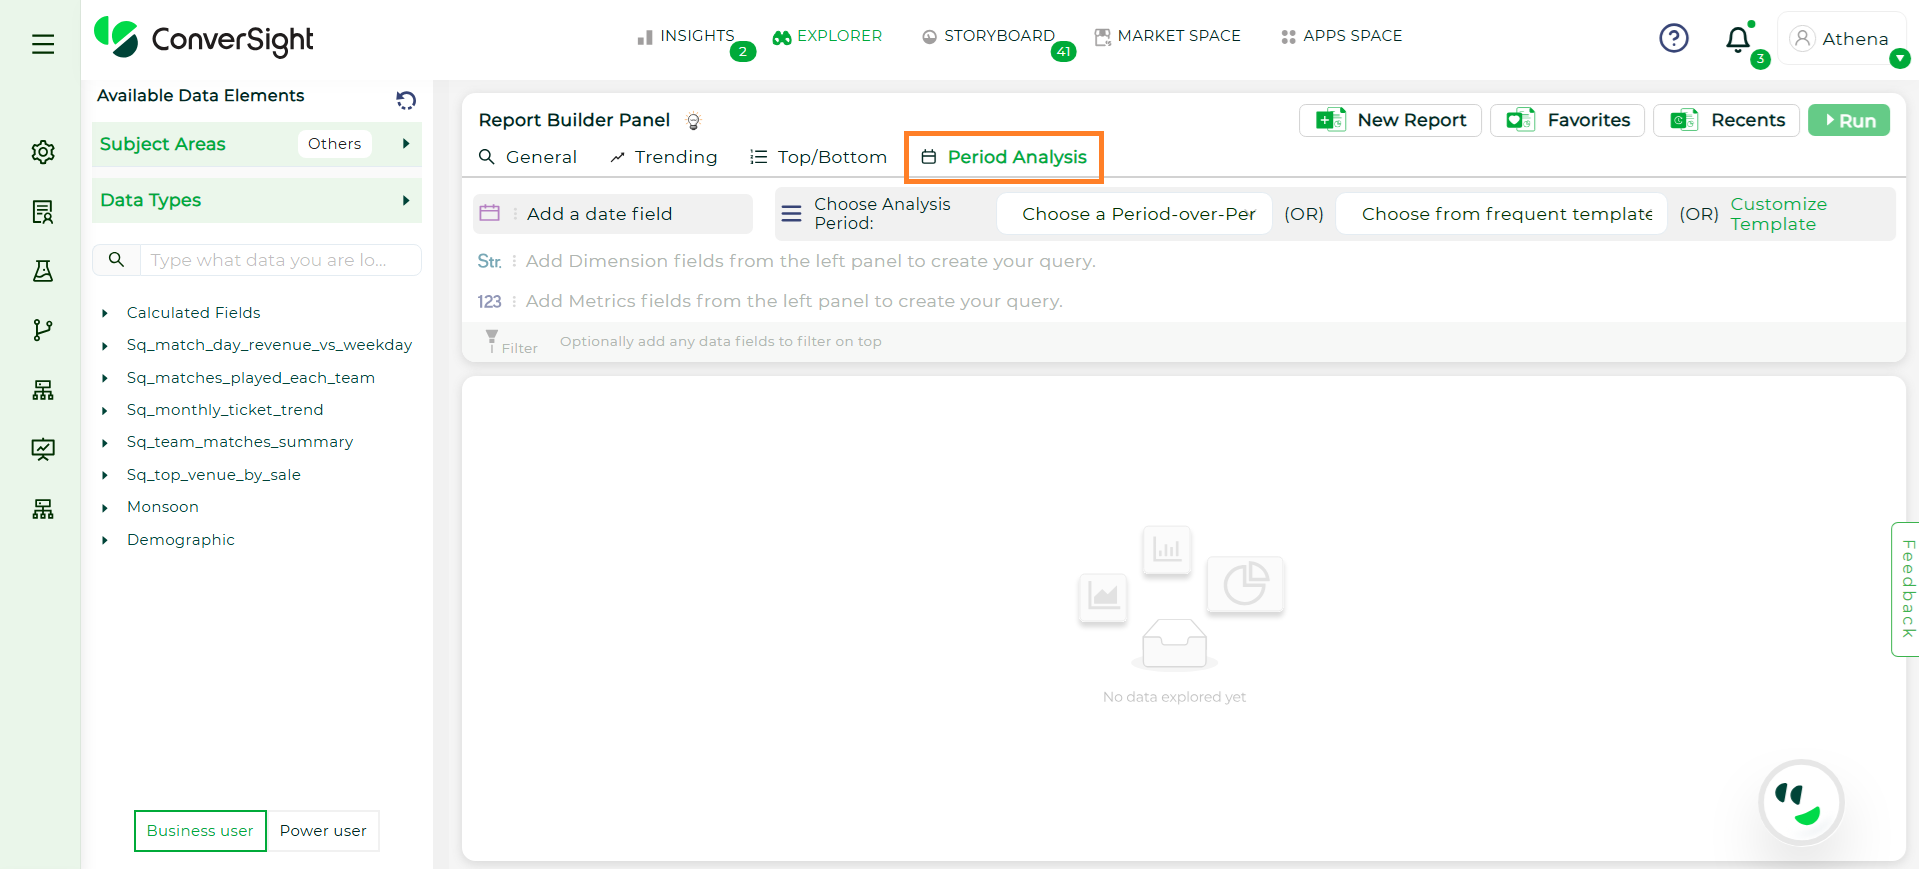
Period Analysis#
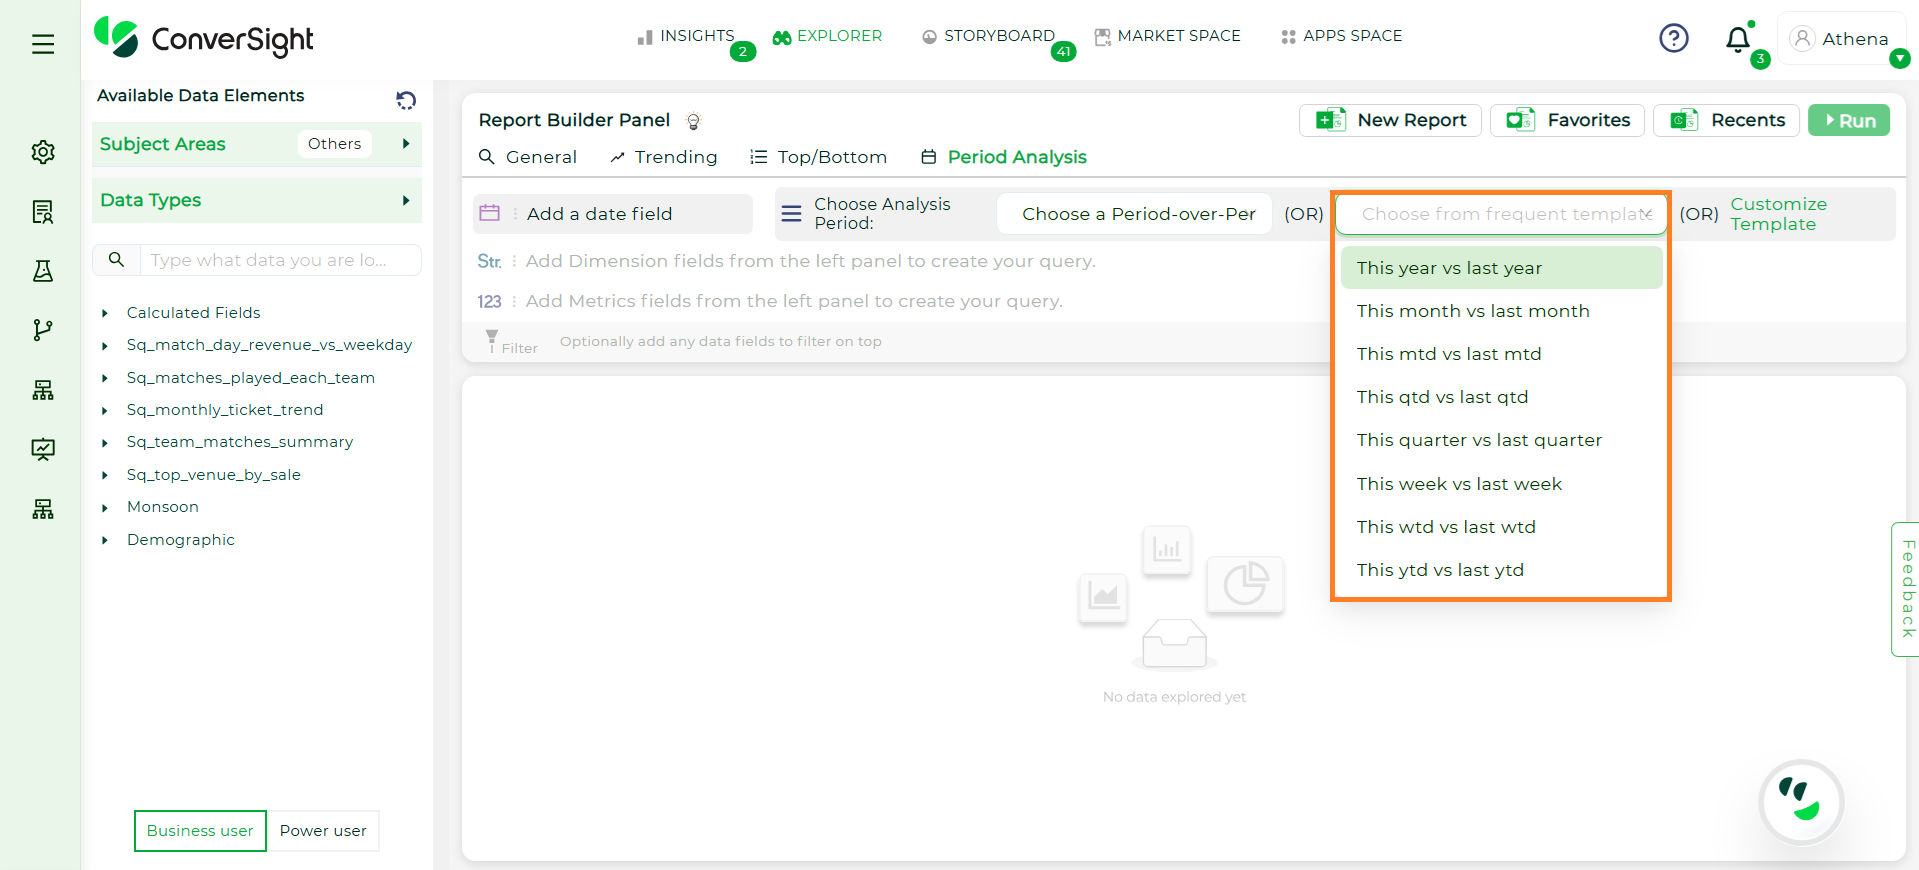
Step 2: Choose the analysis period by selecting either Period over Period or choose from Frequent Template.
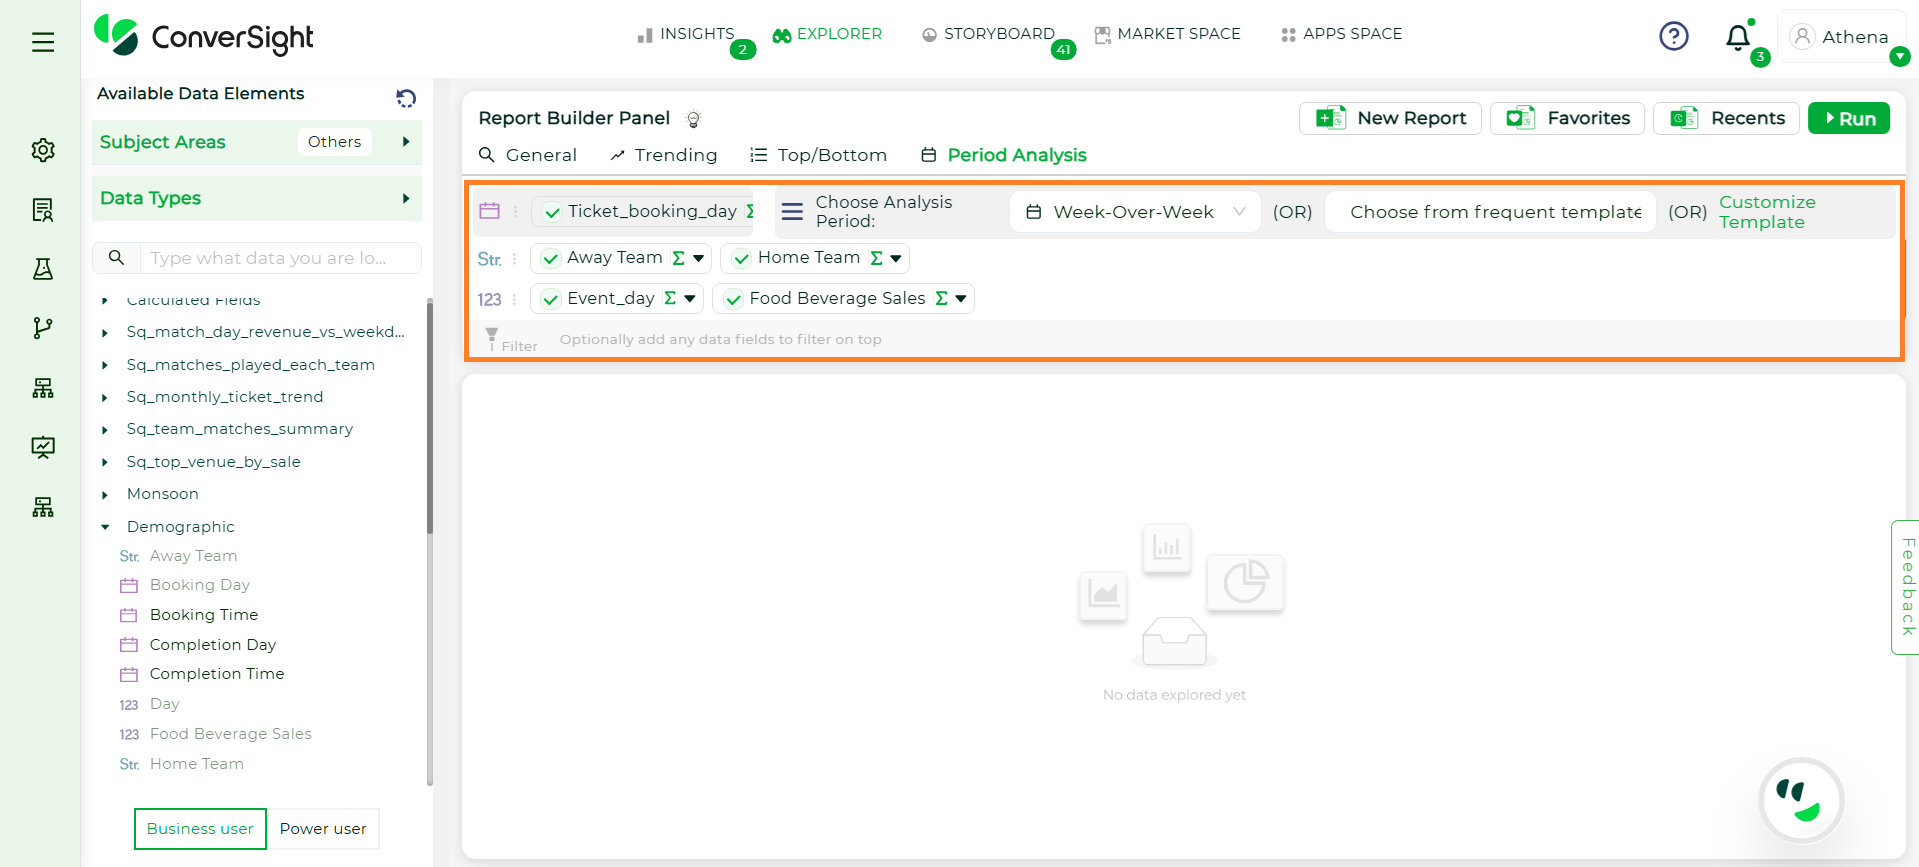
Period-Over-Period comparison options such as Month-over-Month (MoM), Year-over-Year (YoY), Week-over-Week (WoW), or Quarter-over-Quarter (QoQ).
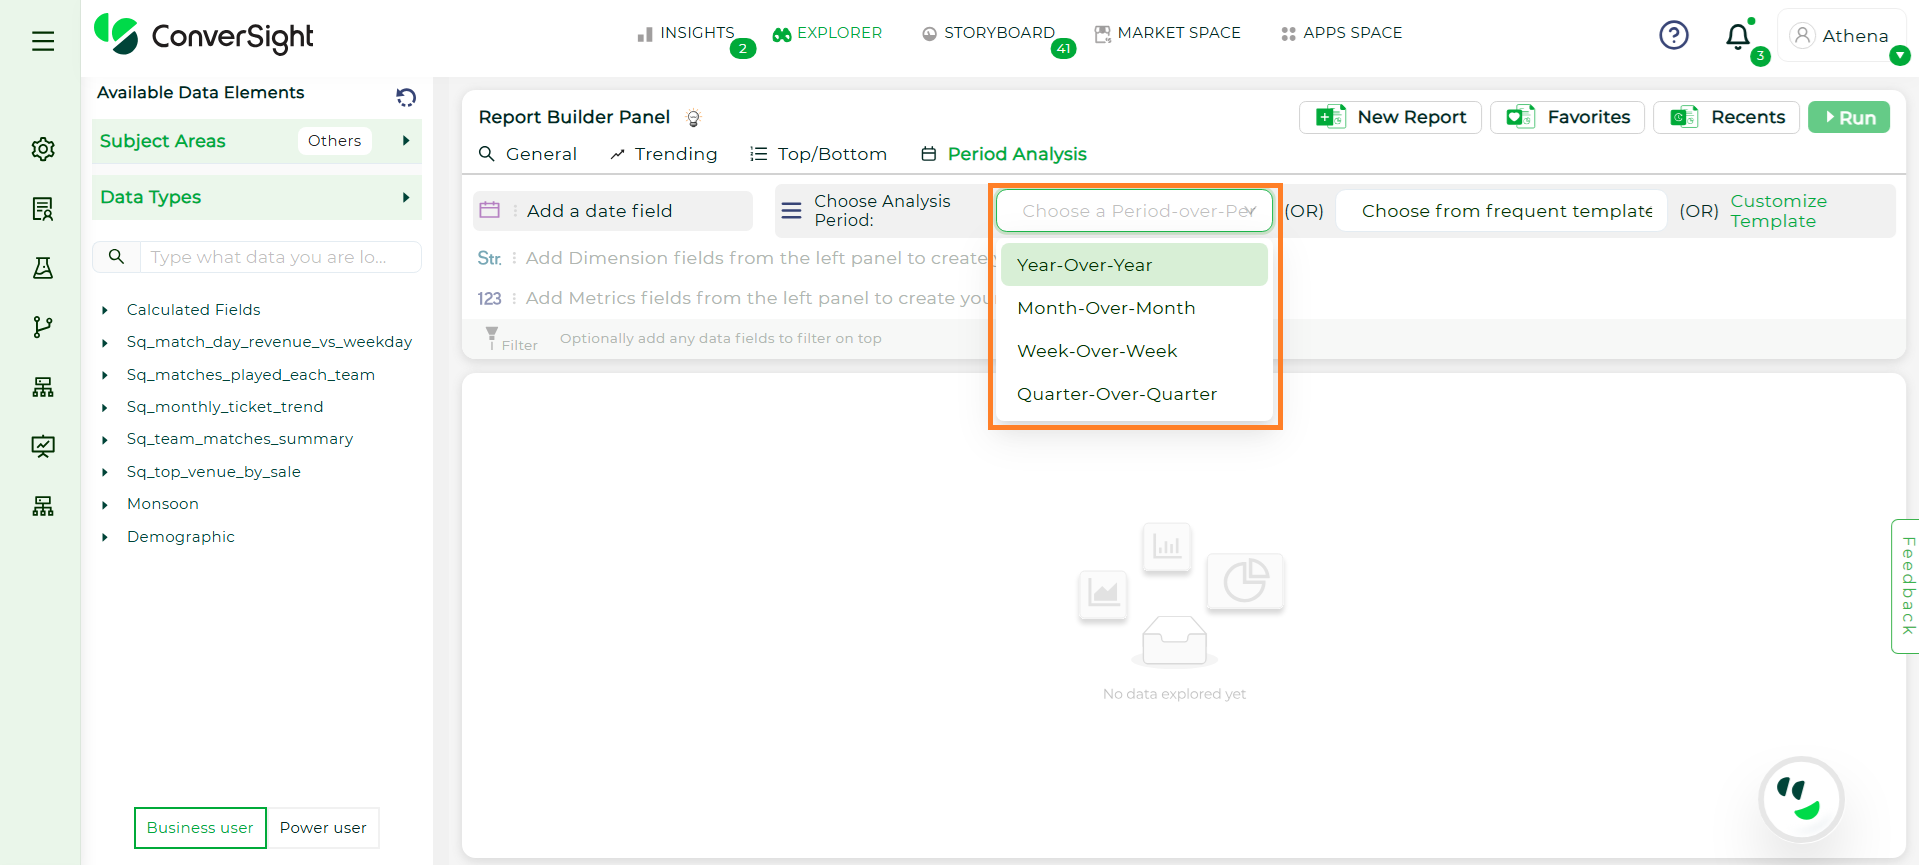
Period Over Period#
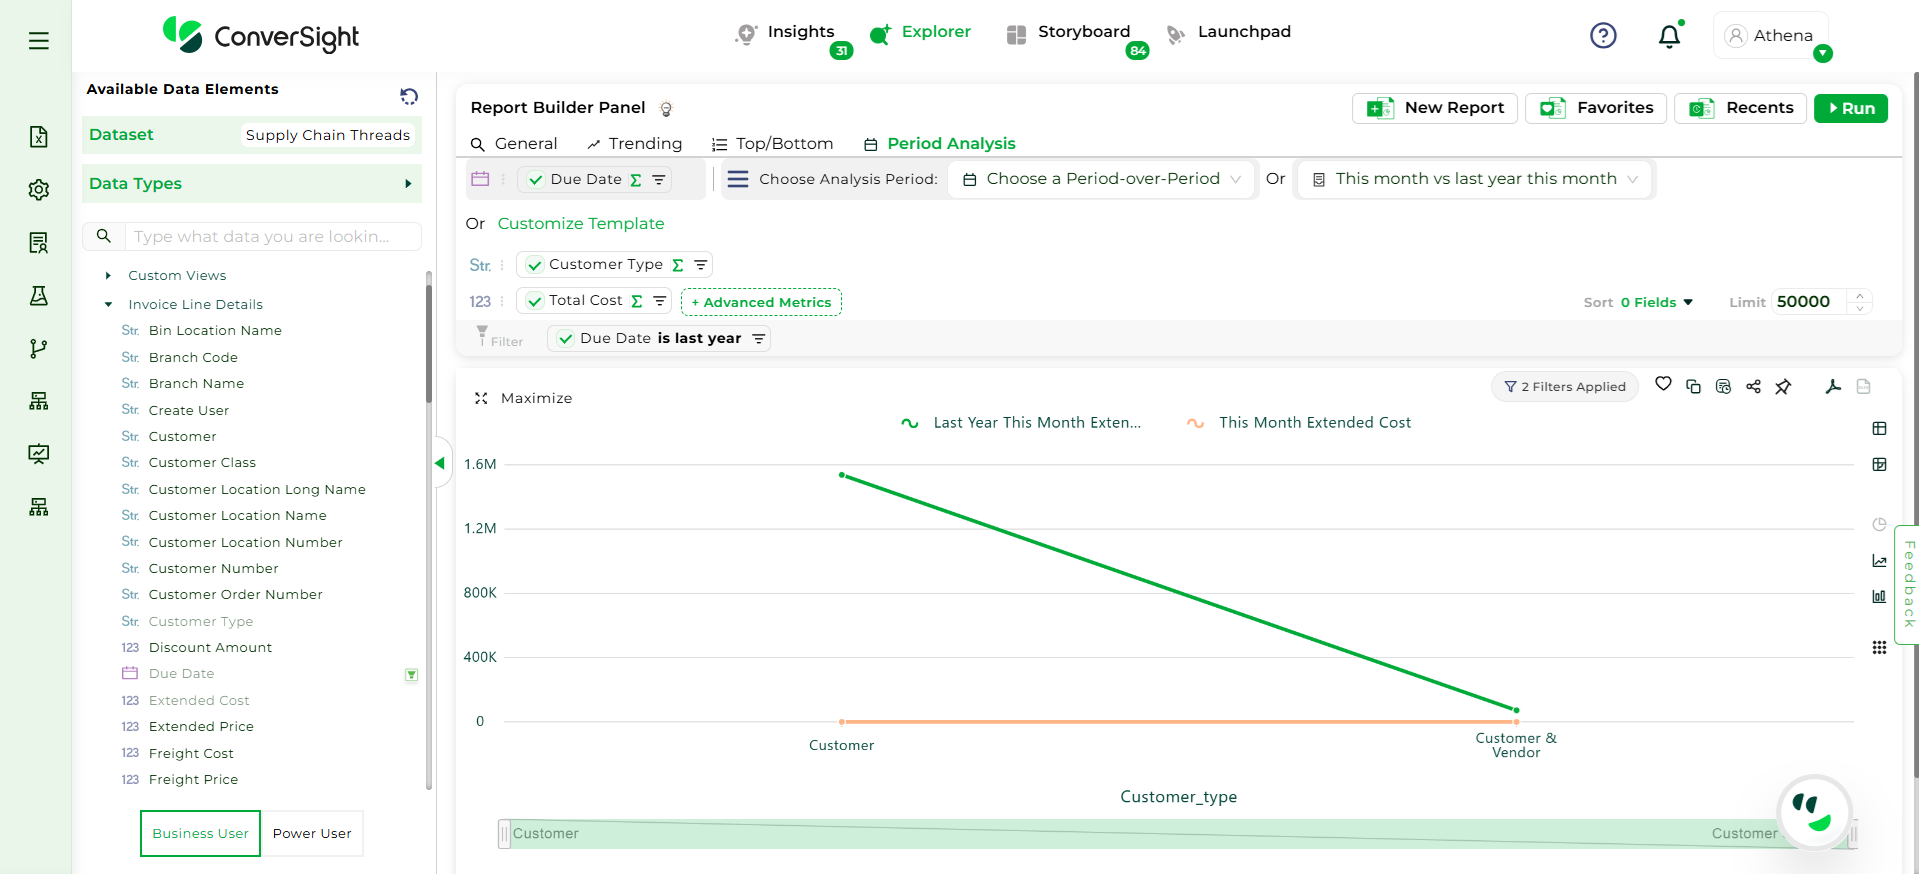
After selecting Period over Period, choose the columns you want to include in the query. In the Metrics column, you can also select Advanced Metrics to view the “Growth Percentage”.
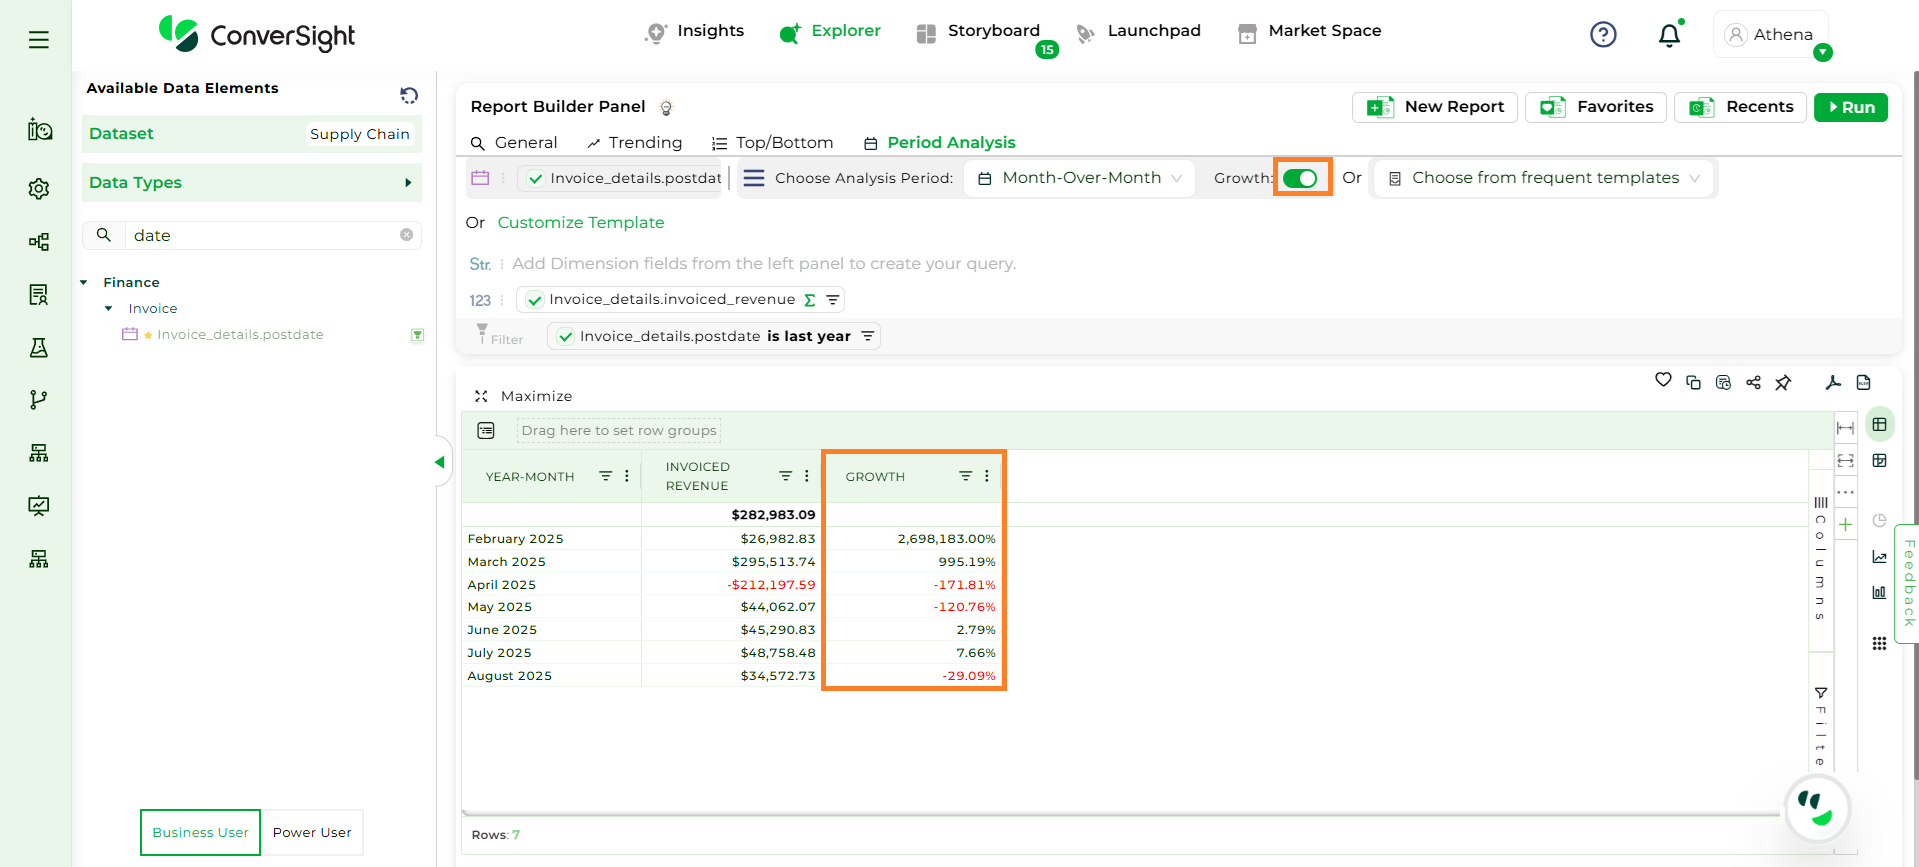
Growth Percentage#
NOTE
Growth Percentage is available only for metrics in Period-over-Period analysis.
Growth Percentage#
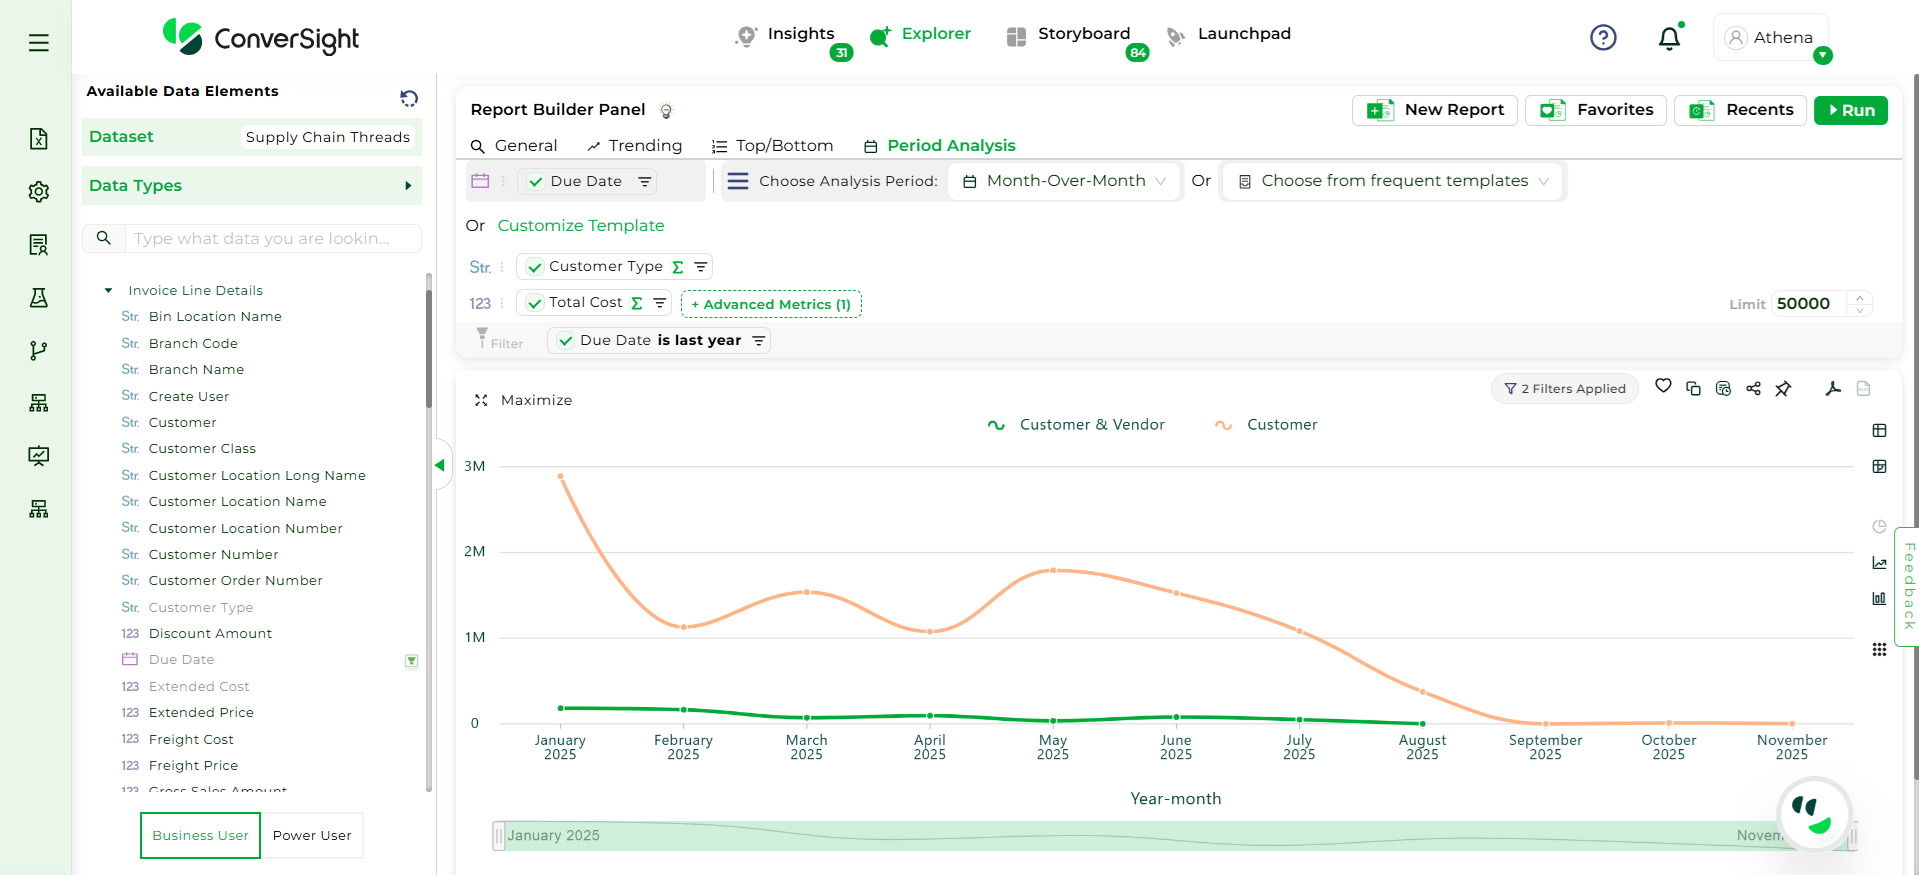
Use a Frequent Template, which includes commonly used time comparisons. Select the required columns, and in the Metrics column, you can also choose Advanced Metrics to view the “Variance”.
Choose Template#
NOTE
Variance is available only for metrics when using Frequent Templates or Custom Templates.
Choose Template#
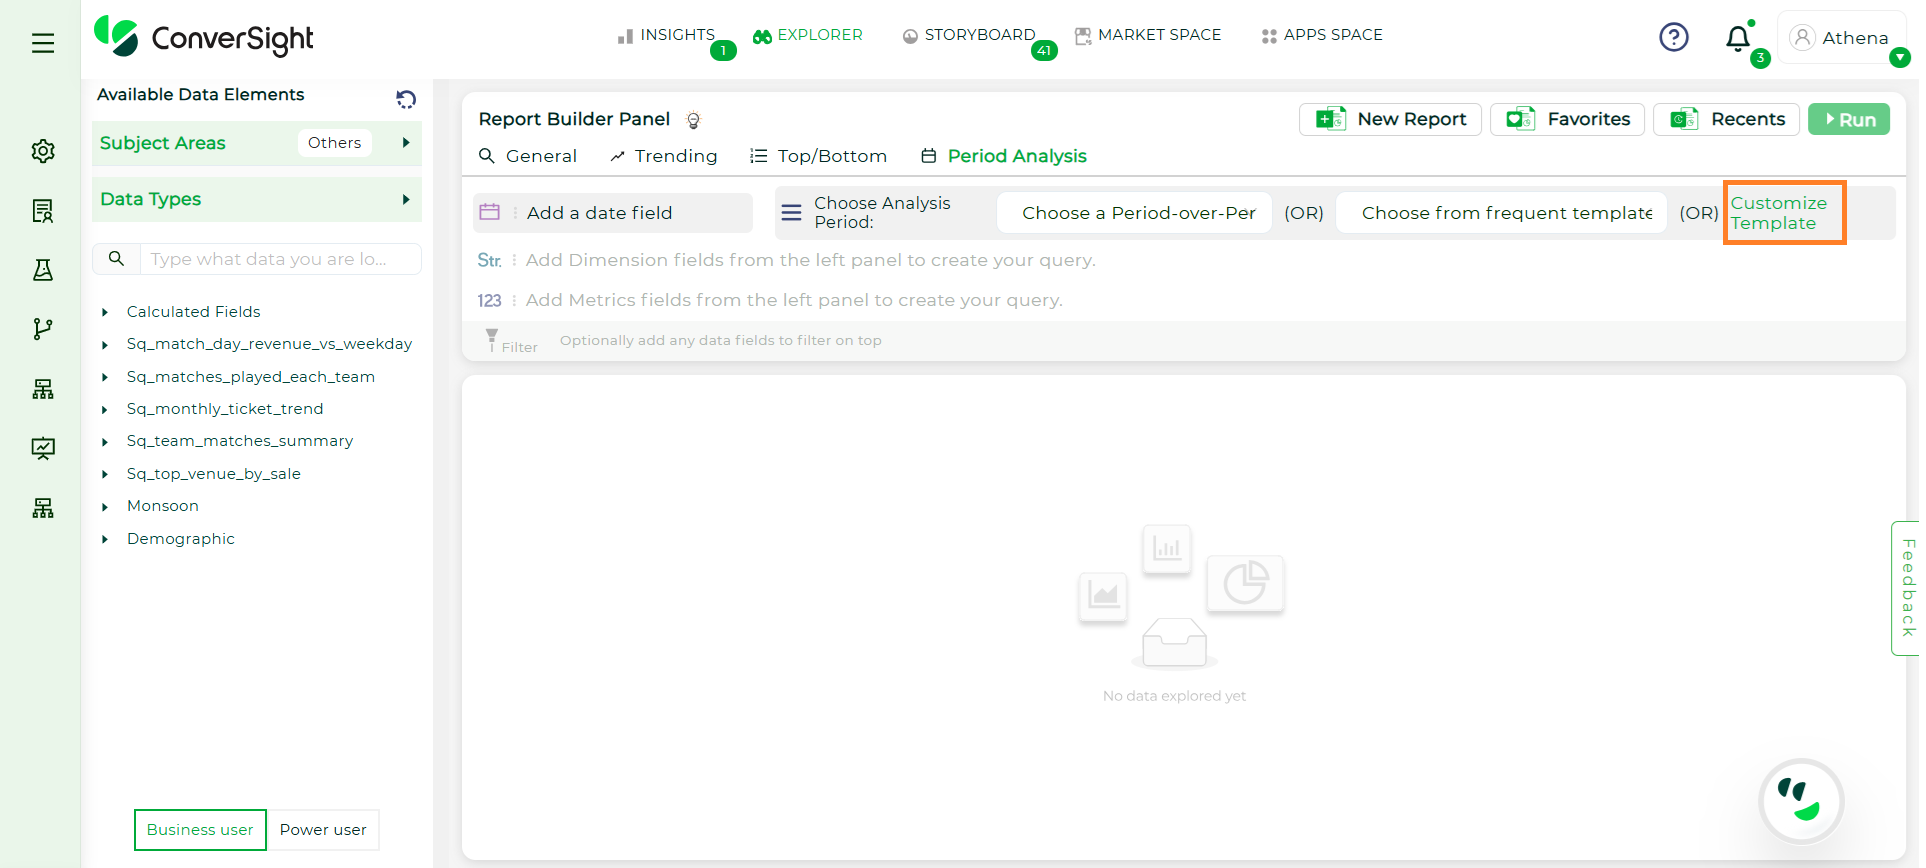
A Customized Template enables users to define reporting periods by either selecting a specific start and end date or choosing from predefined options.
Customize Template#
Additionally, it supports comparative analysis through a Period 1 vs Period 2 format. There is no limit to the number of periods that can be configured—users can compare multiple timeframes for in-depth trend evaluation. This mode also supports comparing multiple dimensions across multiple periods, making it ideal for advanced, customized reporting needs.
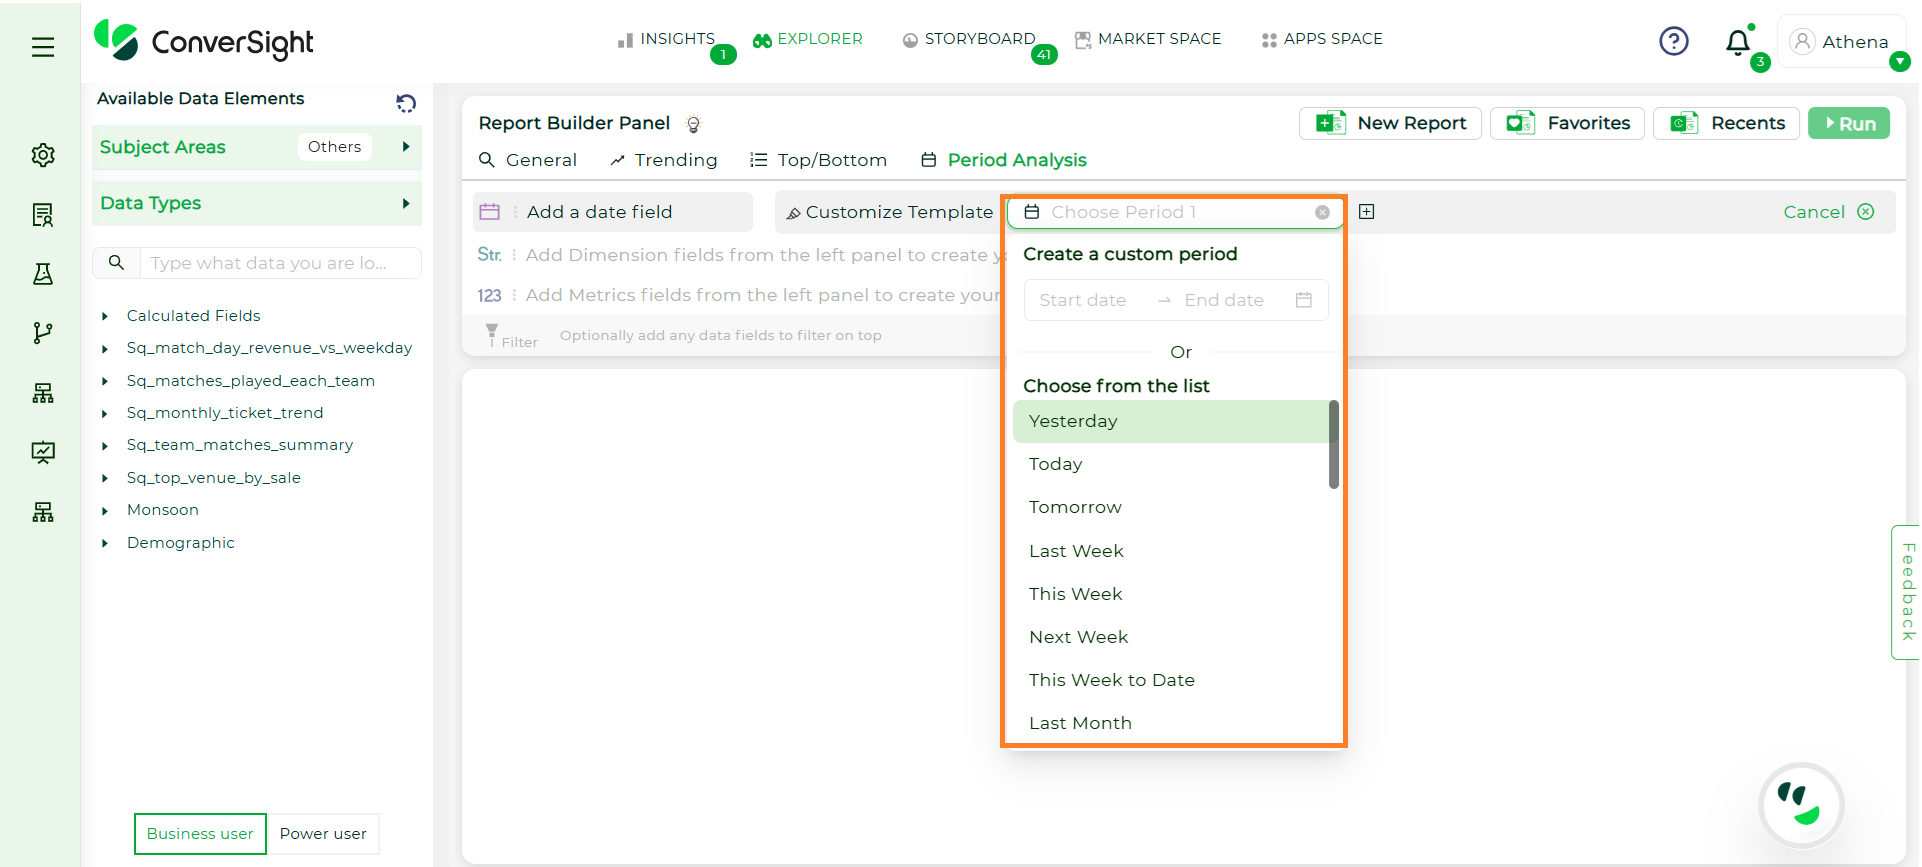
Custom Period#
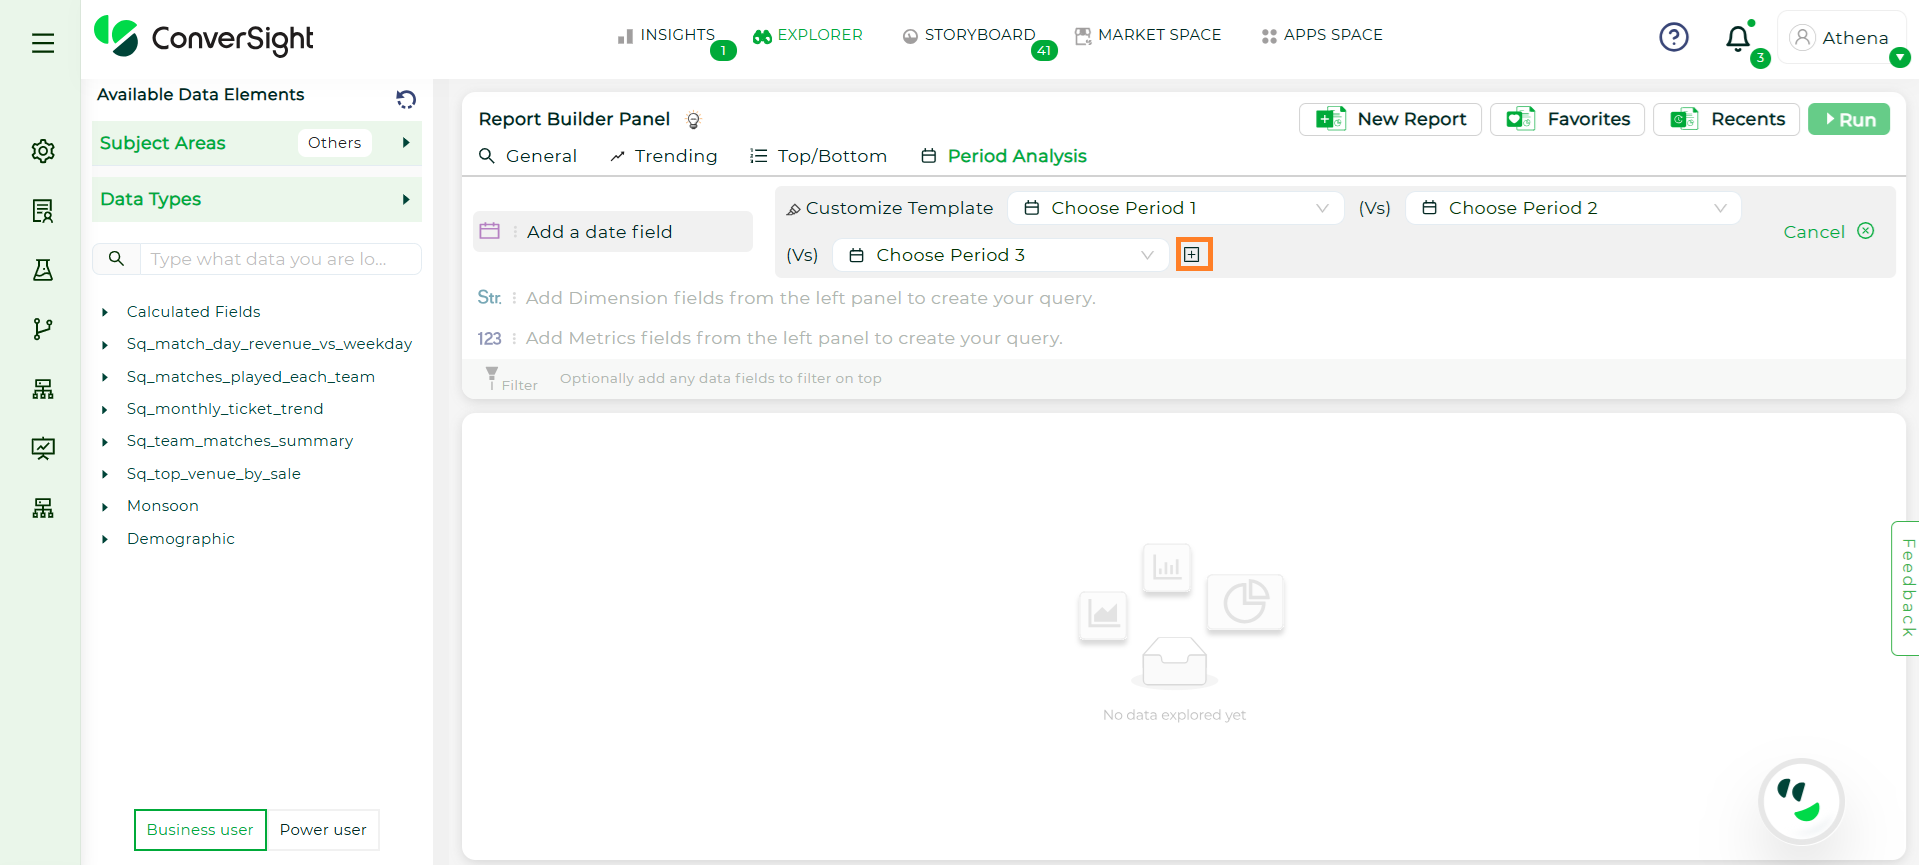
Period Comparison#
In both Frequent Templates and Custom Templates, you can sort reports with metric columns. Select the desired Metric field and choose the sorting order as Ascending or Descending to organize the report data accordingly.
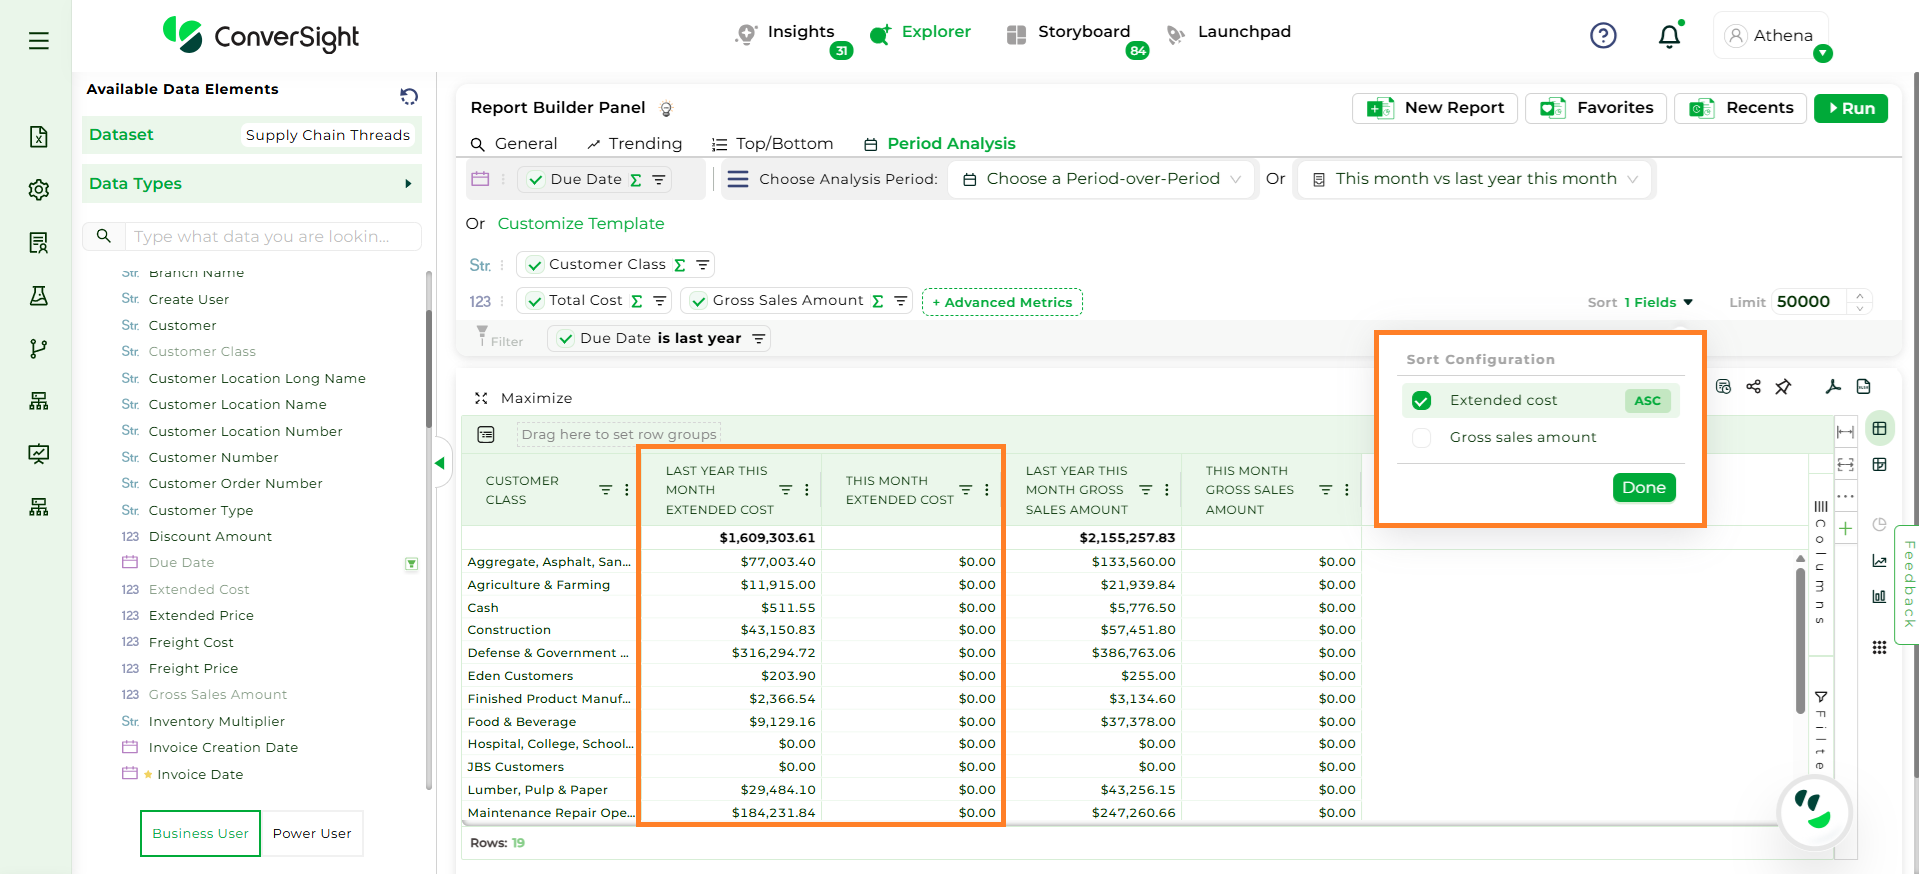
Sorting#
Sorting#
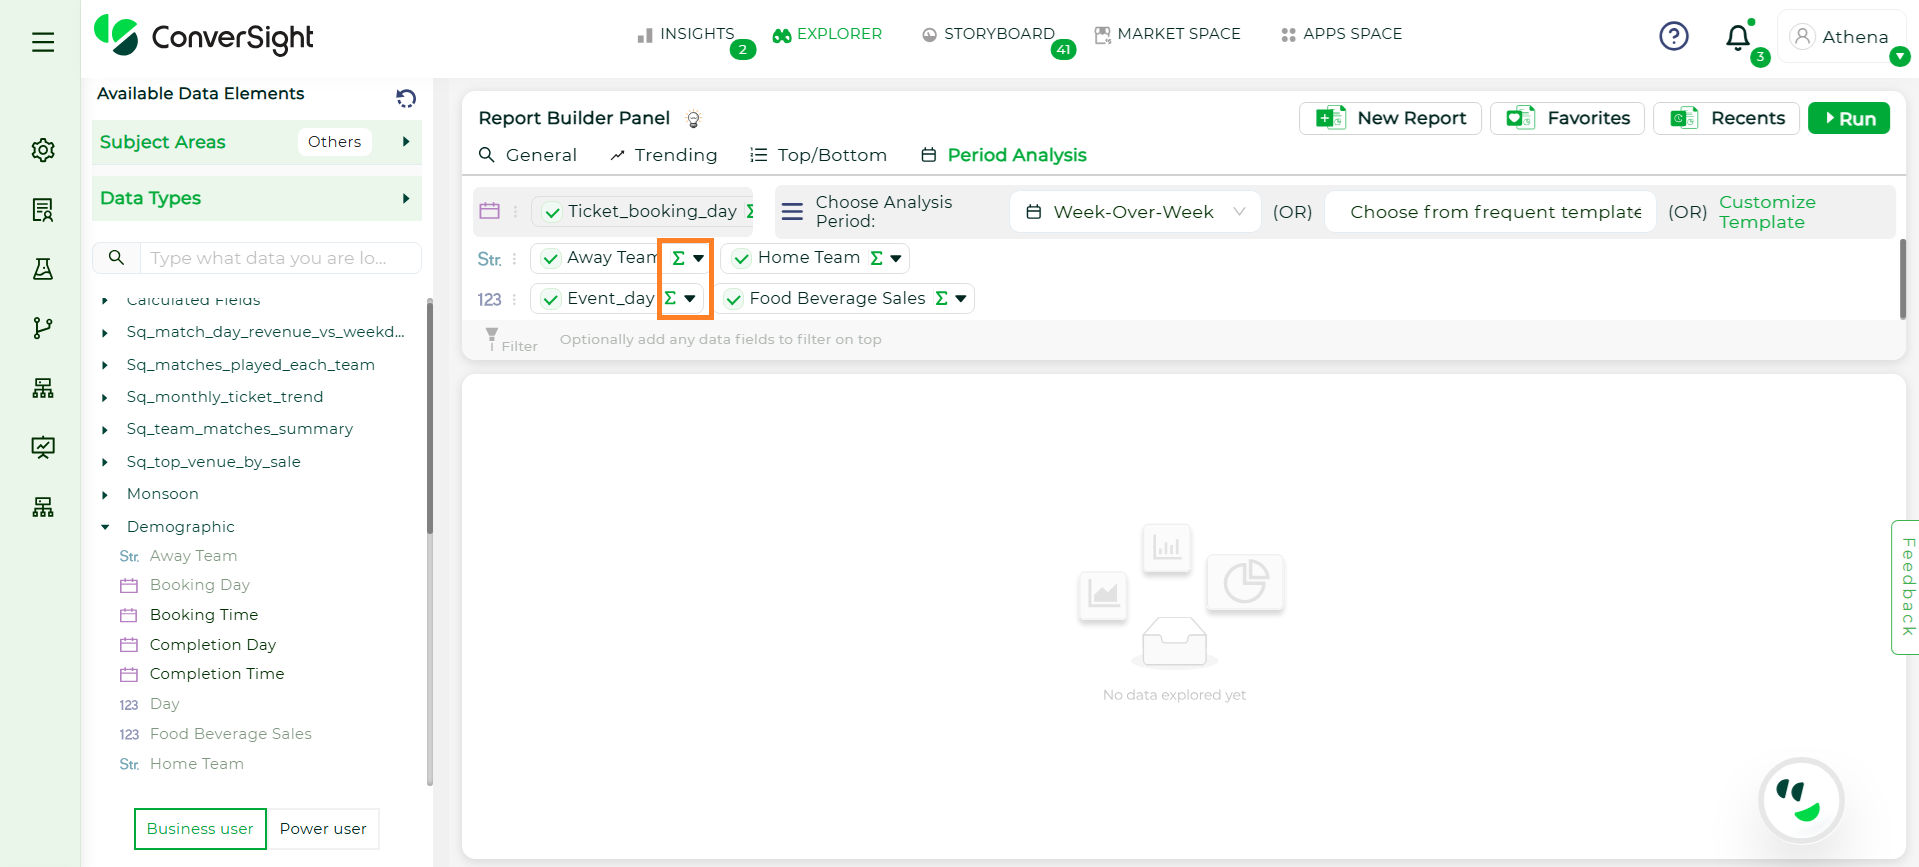
Step 3: To configure a Period Analysis, select exactly One Date field and At Least One Metric. There is no restriction on Dimensions - you may select as many as needed.
Choose Columns#
NOTE
The Run button remains disabled until both a Date and at least one Metric are selected. Only one date can be selected — choosing a new one will replace the existing selection.
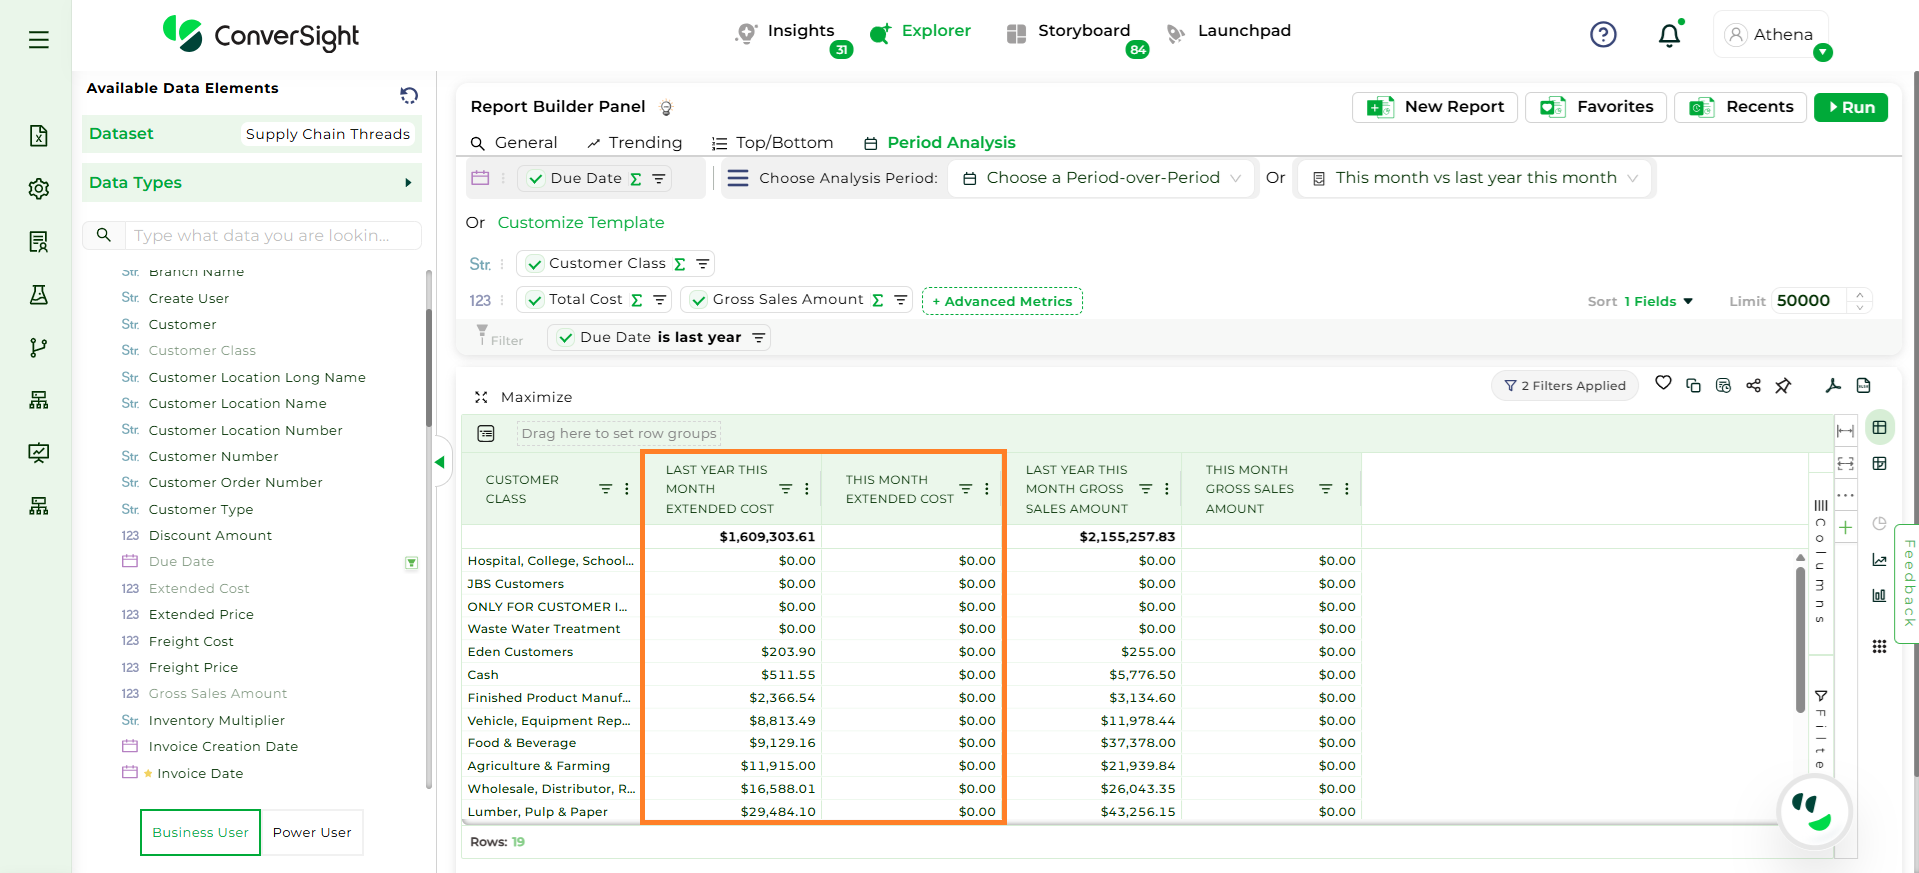
Step 4: Aggregation is supported for the selected Metric and Dimension column. For metrics, aggregations include Sum and Average while, Dimension supports Count; additional aggregation options will be added in a future release. Filtering is supported for Date columns, allowing you to narrow down data based on specific time ranges.
Aggregation#
Step 5: Once the fields are selected, click Run to execute the query and view the analysis results.
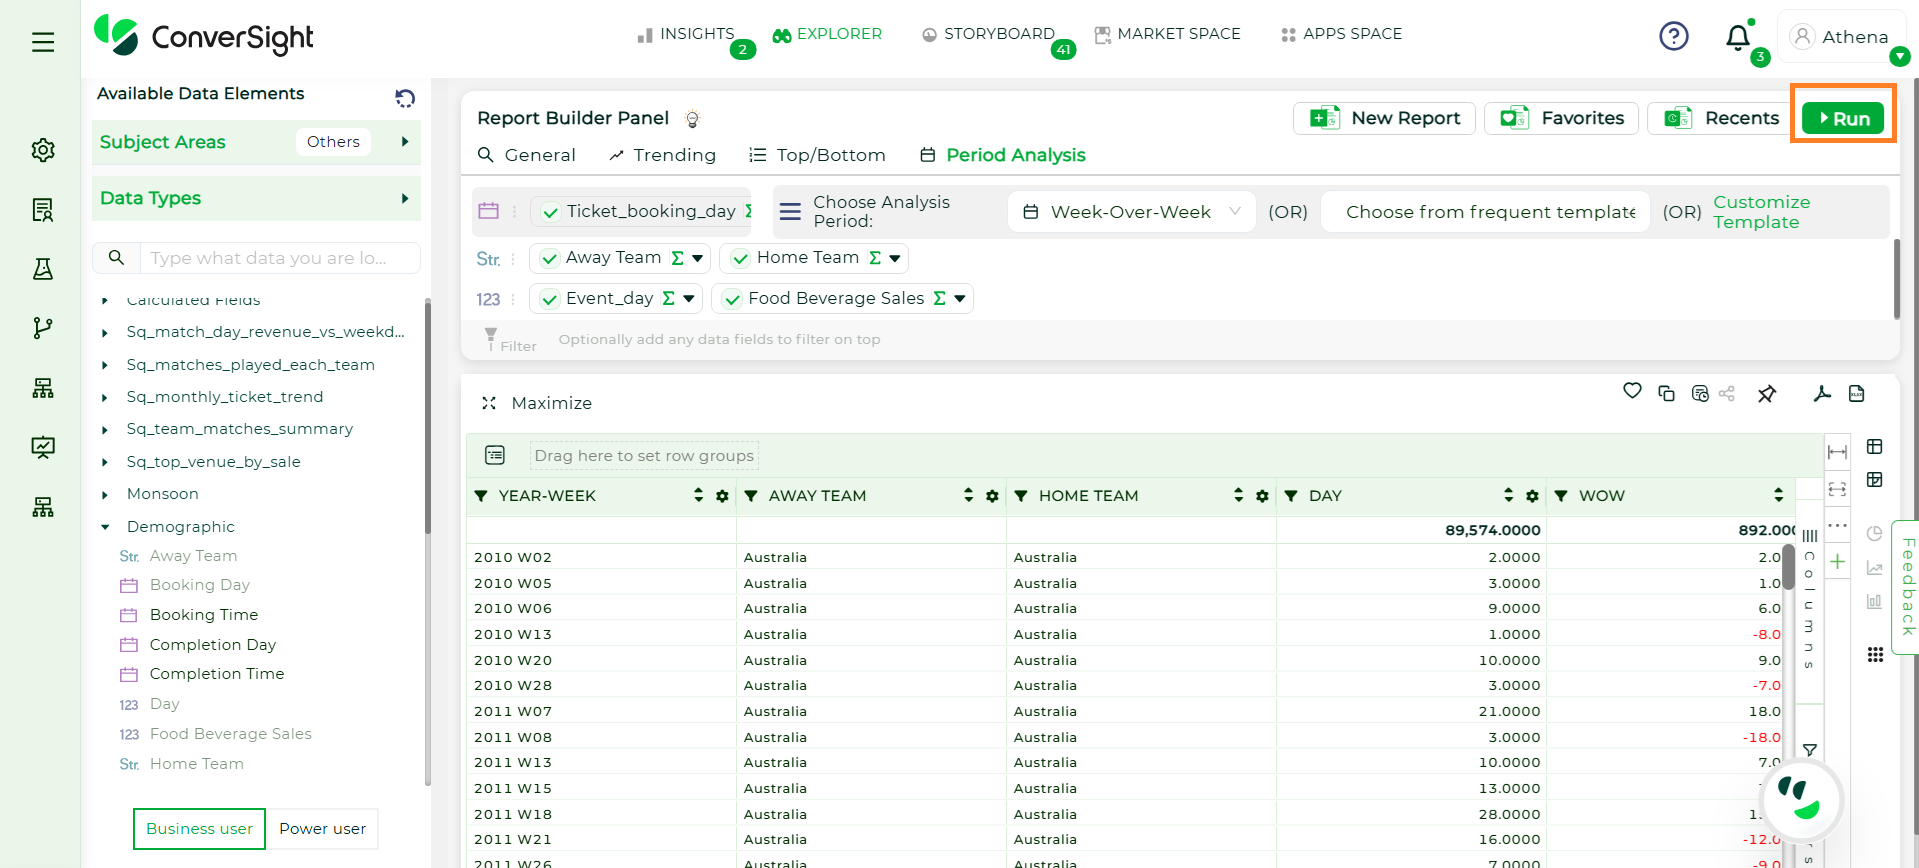
Run Button#
Row Limit
The custom row limit controls the maximum number of rows displayed in the report results, up to 50,000 rows.
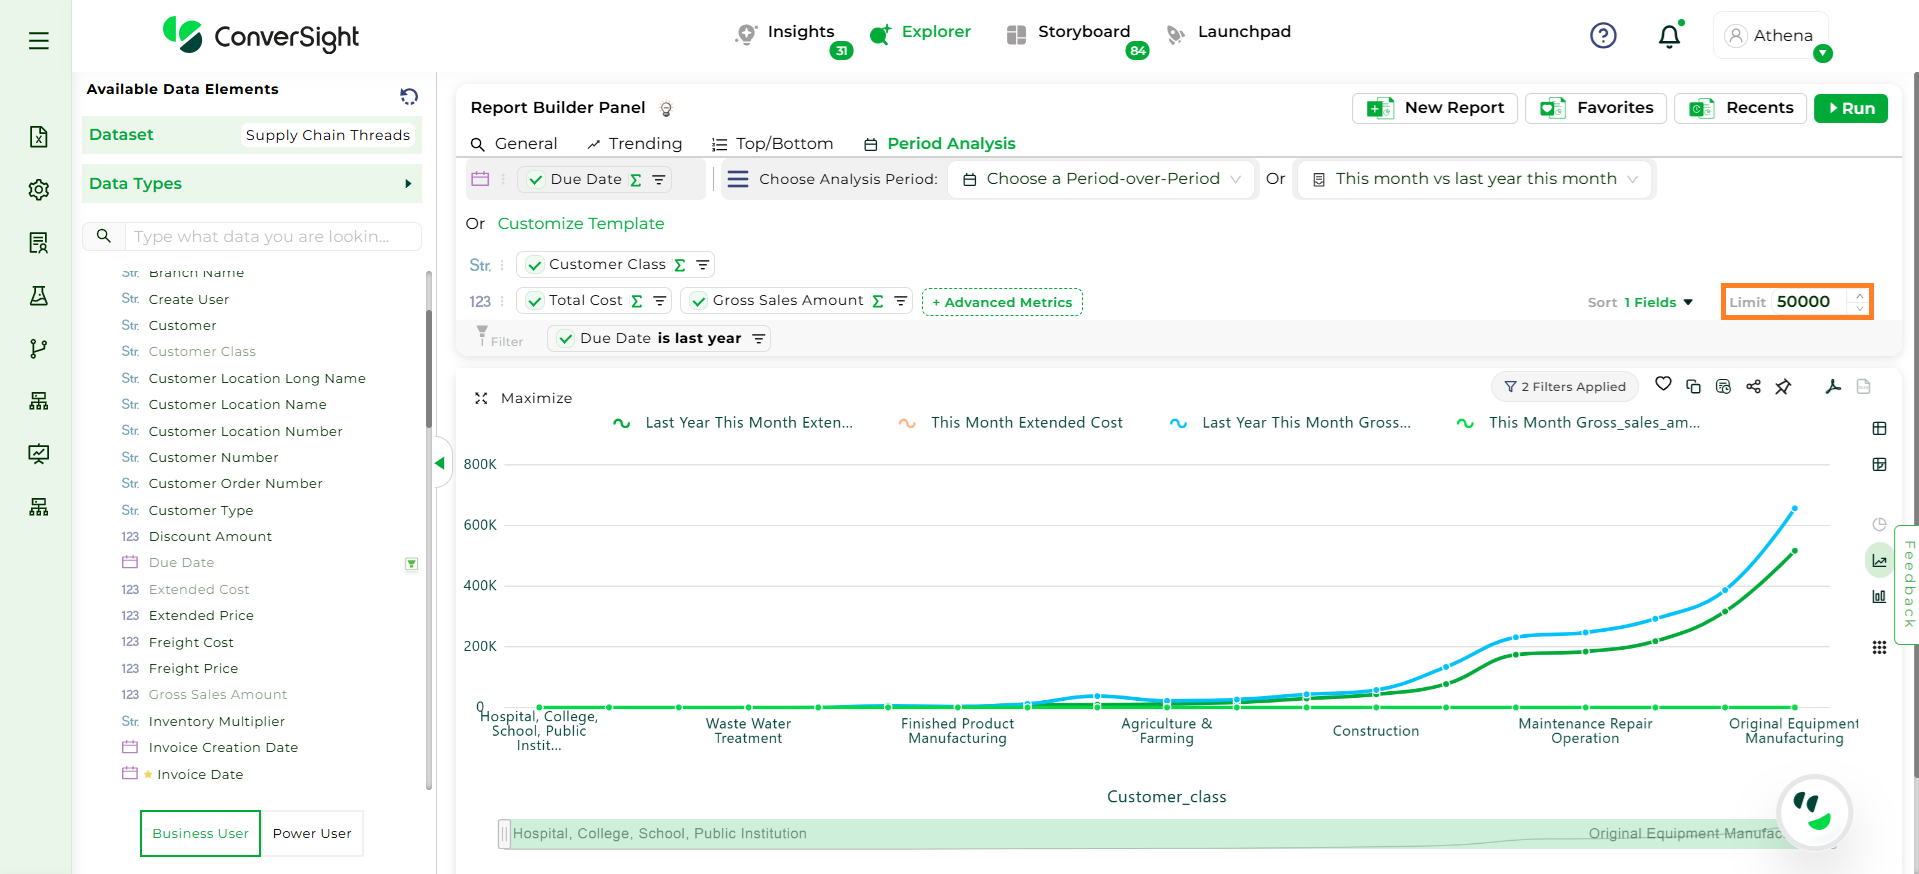
Custom Row Limit#
Restrictions in Explorer
There are certain limitations to be aware of:
External Sharing is Restricted: To preserve data security and context, chat-based queries stay within the platform.
Smart Columns Limitation: Smart Columns are not currently applied within Athena Threads. However, upcoming improvements will begin enabling them — with single-table queries only — allowing for more contextual insights while keeping performance optimized.