Control Tower#
A Control Tower is an advanced data collection, integration and standardization tool for operations management. The technology offers end-to-end visibility of operations in real-time, enabling very realistic decision making. The Control Tower is intended to consolidate data from internal and external business partners. This strategy provides real-time visibility into supply chain operations and enables better informed decision-making based on a holistic picture of the facts. Control Towers can be combined with Digital Process Automation to create a fully digitalized process control environment. They can be applied to many stages of operations management, such as transportation, warehousing, production, co-packing and even a global end-to-end perspective.
The Control Tower predicts and anticipates probable interruptions with the use of machine learning algorithms, allowing for proactive response and exception management. The Control Tower provides various advantages, such as greater awareness and insight into supply chain operations, the ability to address possible interruptions and the capacity to execute and fulfill supply chain objectives through a collaborative intelligent response framework. Through the capturing of particulars and specified empirical values, the Control Tower also facilitates ongoing discovery and learning.
Control Tower#
The data acquired by the Control Tower is standardized and provides a source of personalized information, providing for comprehensive supply chain visibility. This enables the company’s various divisions and areas, as well as its external partners, to collaborate in attaining the operations worldwide objectives.
Overview#
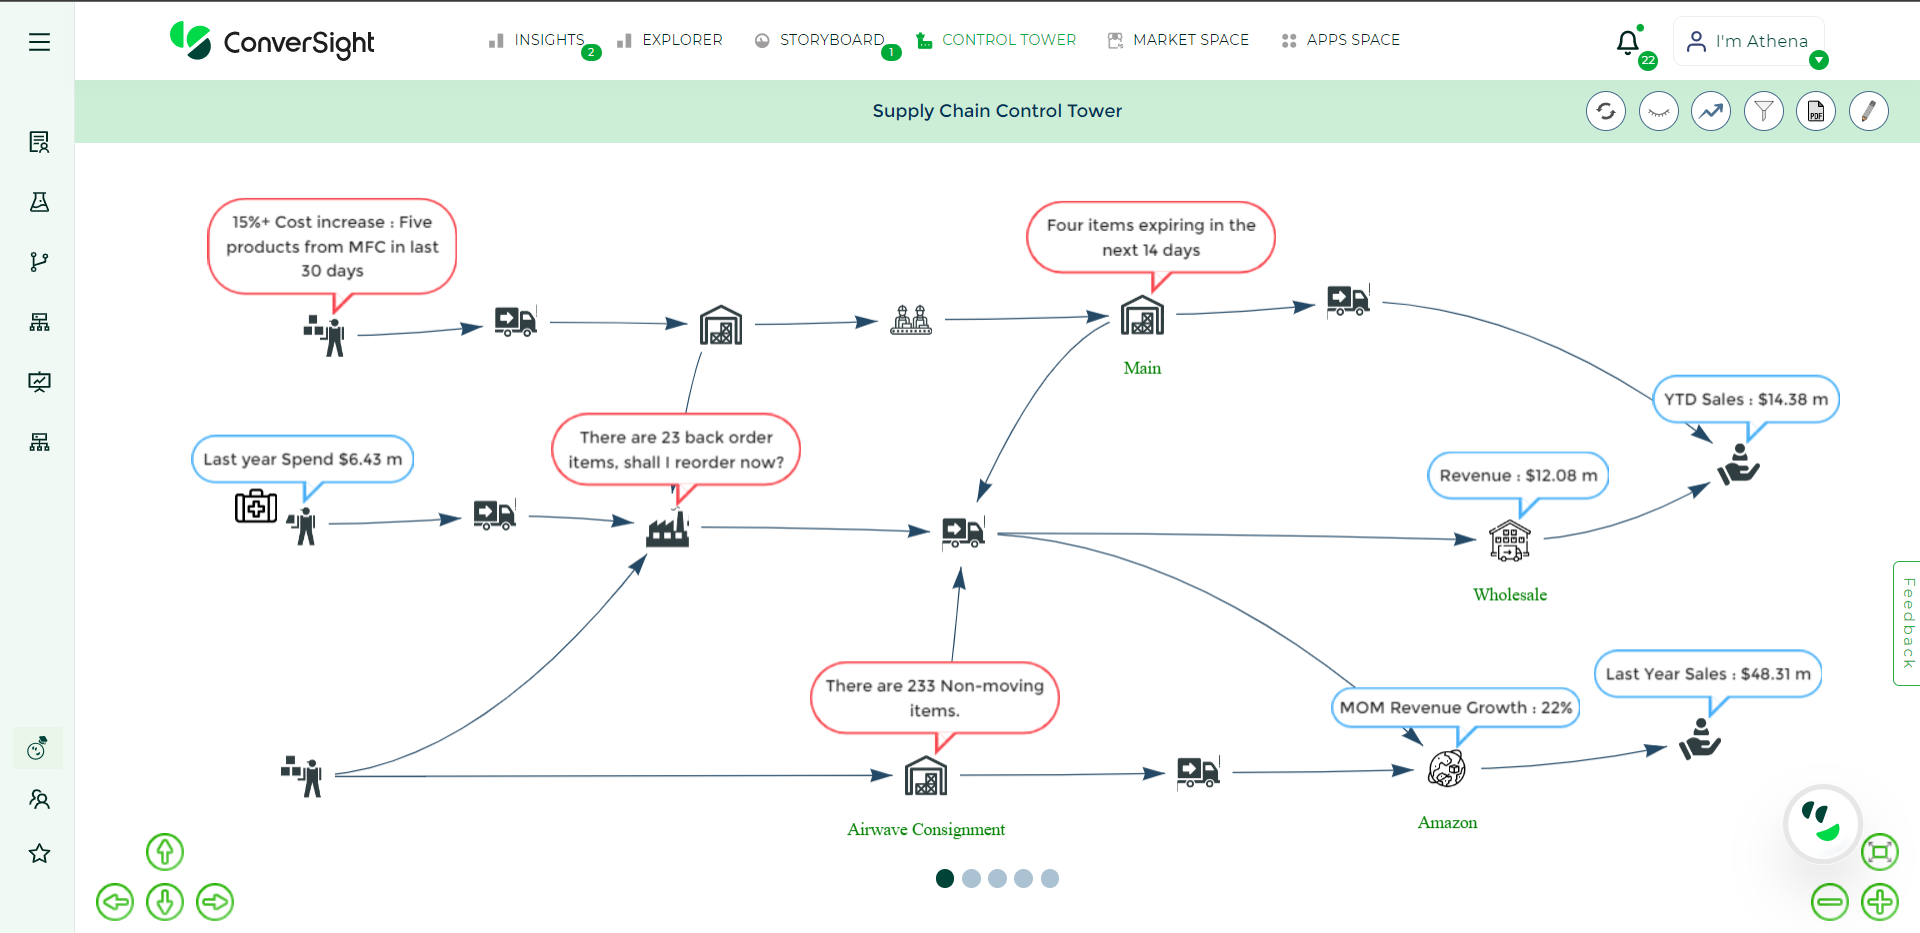
Control Tower offer a comprehensive solution for managing the complexities of the supply chain. With real-time visibility and advanced analytics, companies can make informed decisions, respond to disruptions proactively and optimize their operations for maximum efficiency and success.
Control Tower Illustration#
To watch the video, click on Control Tower Overview.
Creation of Control Tower#
Let’s explore the process involved in building a Control Tower.
Step 1: Navigate to the Control Tower tab in the landing page.
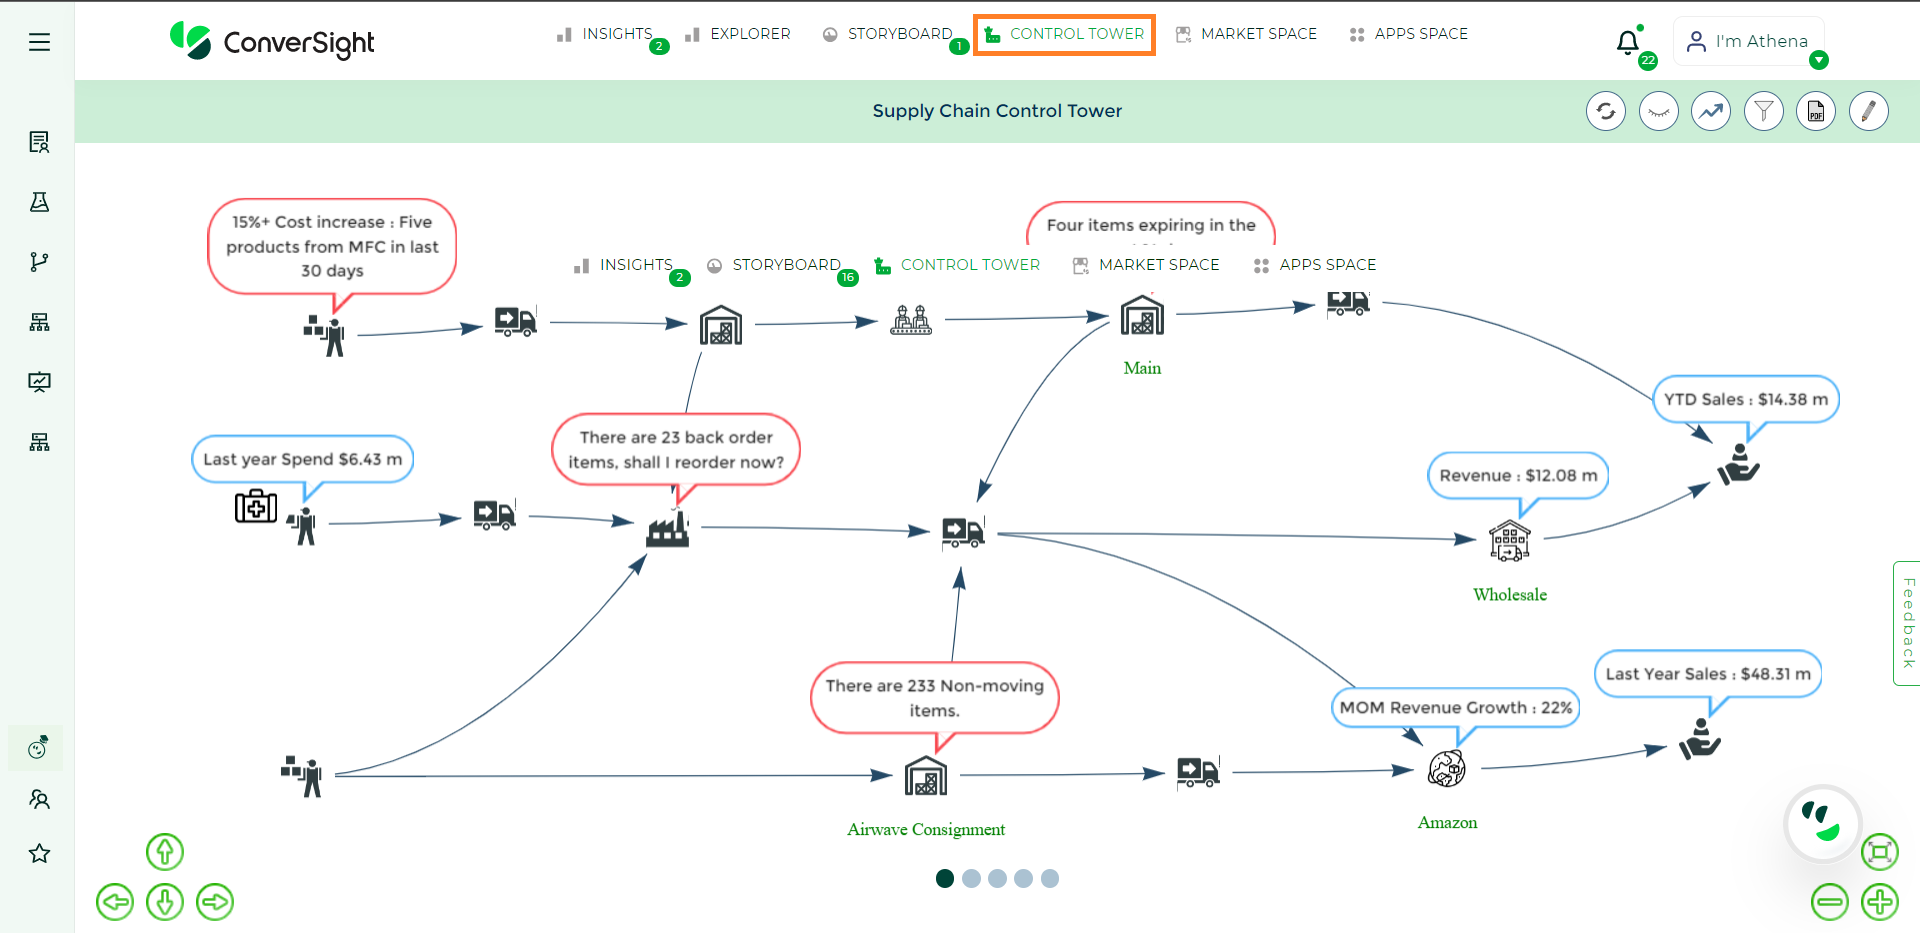
Control Tower Tab#
Step 2: On the Control Tower page, you will encounter several choices. To initiate the creation of a new Control Tower, simply select the Edit icon located on the right-hand side.
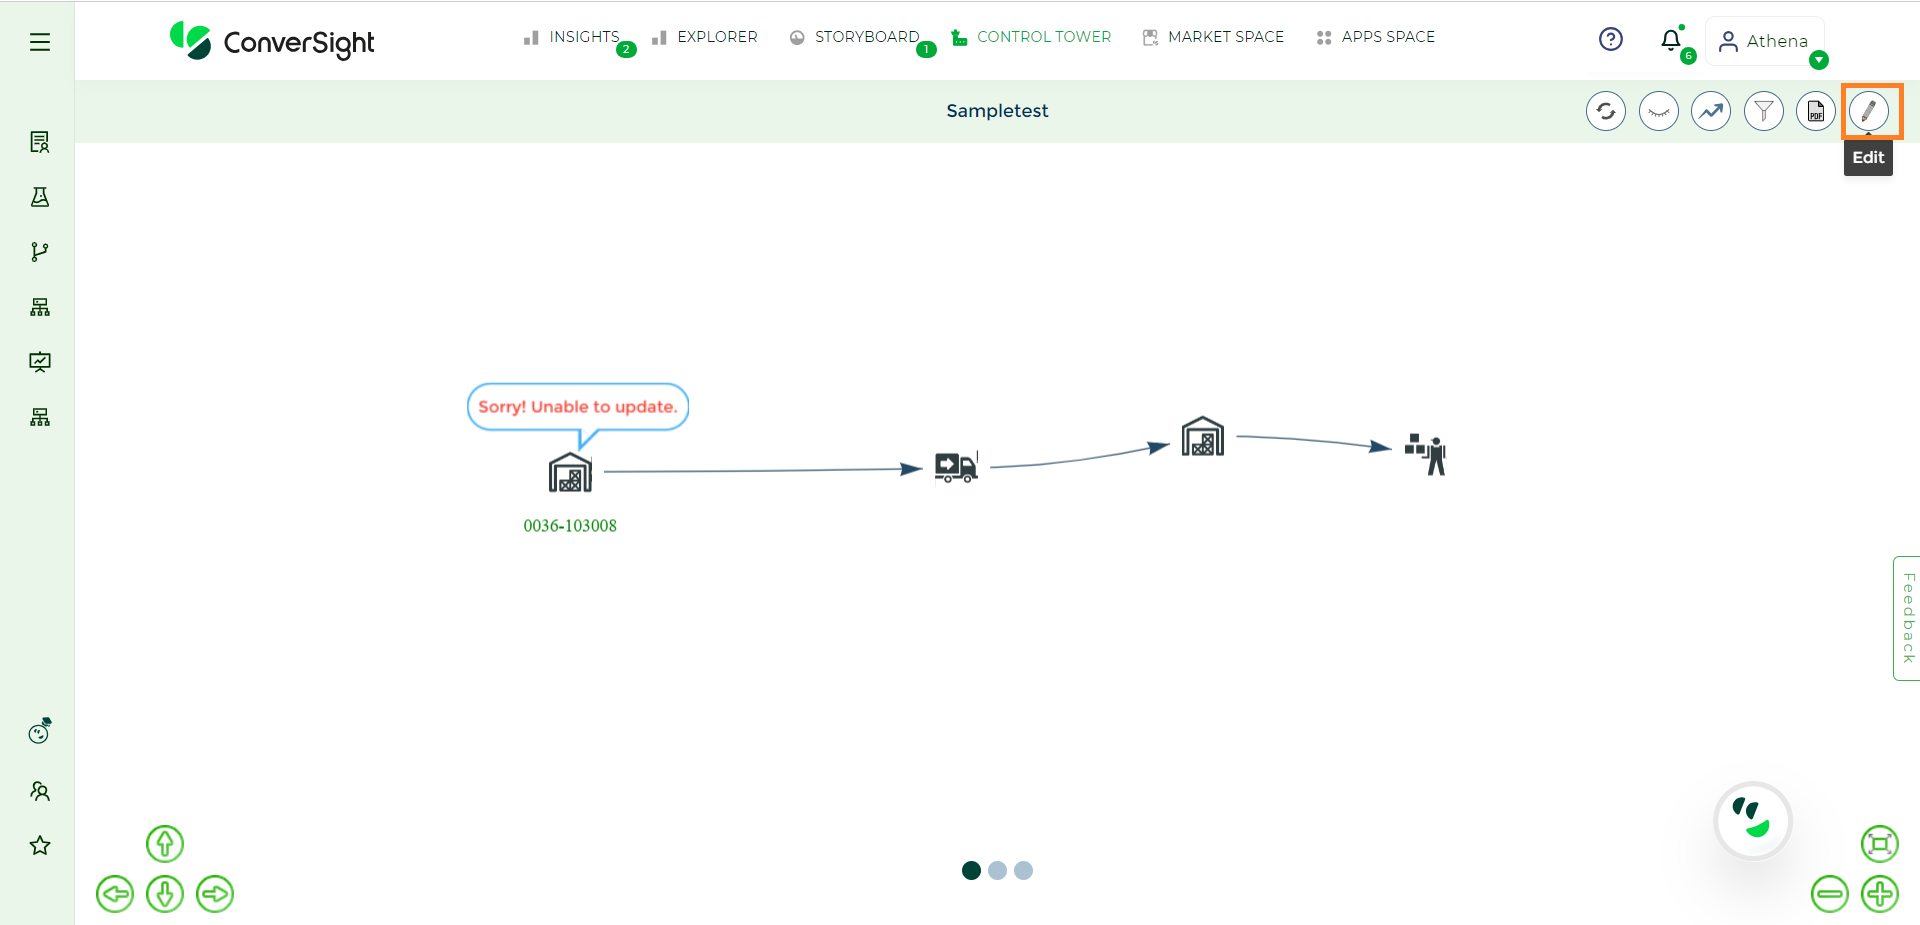
Edit#
Step 3: Click on the Towers menu to create a new Control Tower.
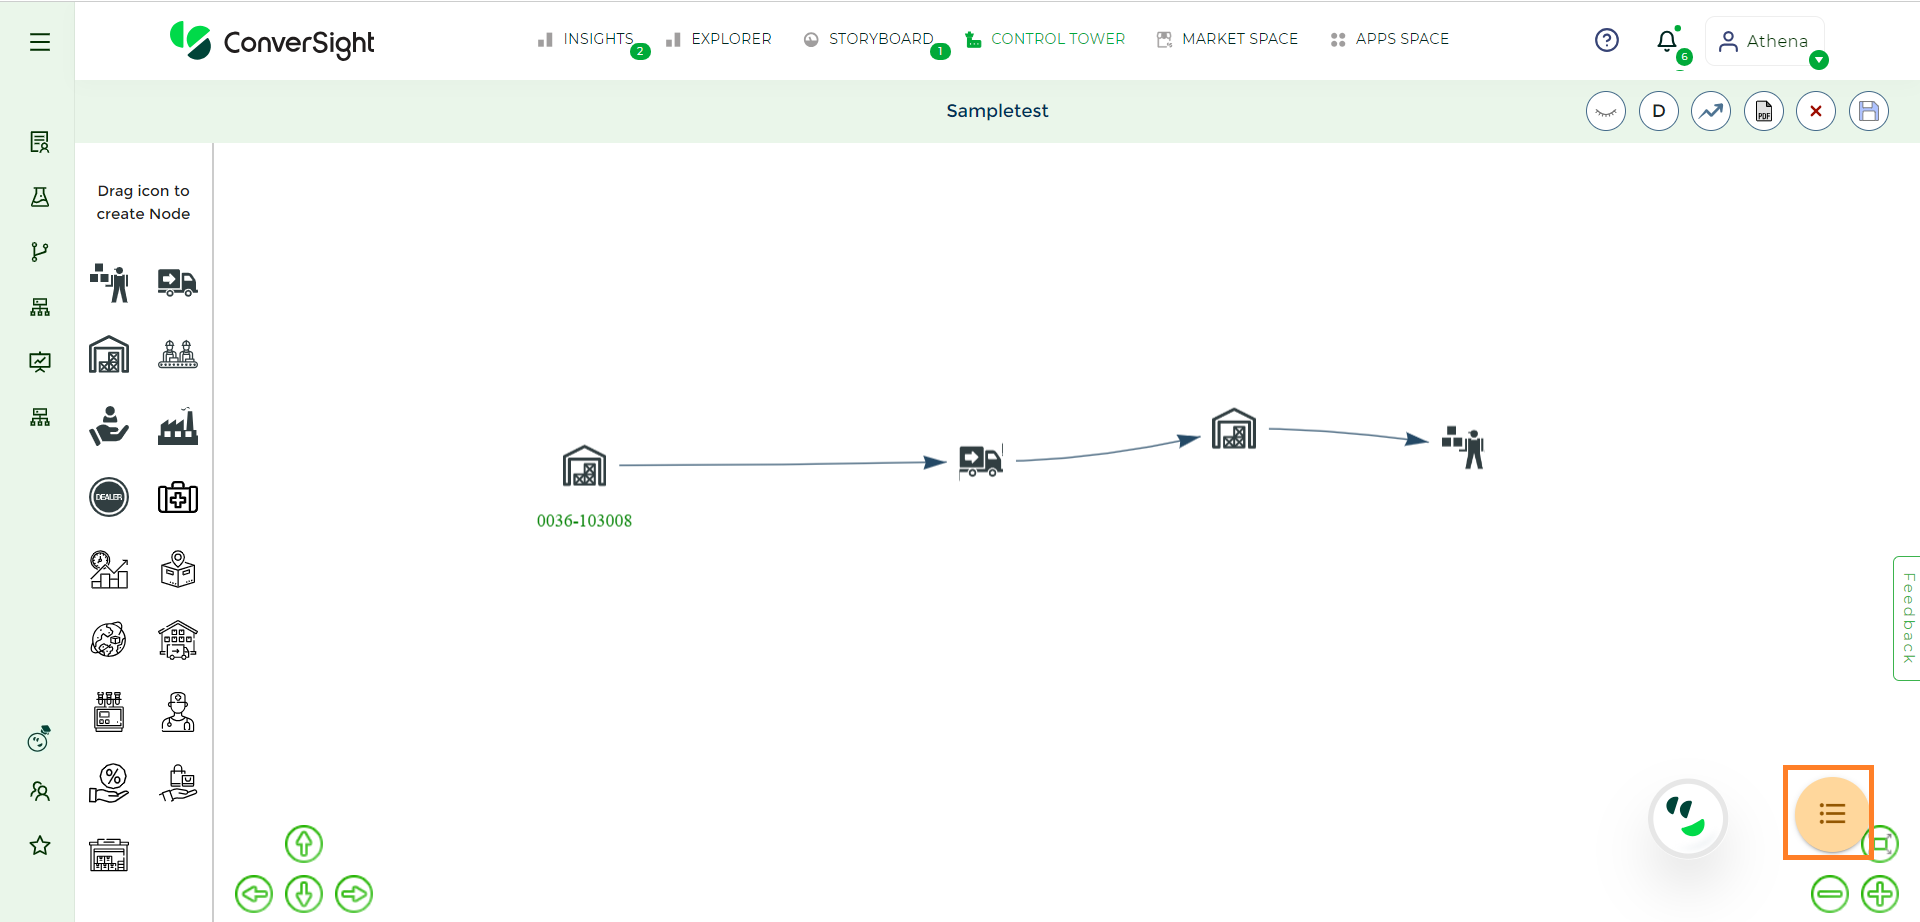
Towers Menu#
Step 4: In the Towers menu, you’ll find a list of Control Towers that have been created. To initiate the creation of a new one, just click on the Add button. Input a name for your Control Tower and proceed to select a dataset.
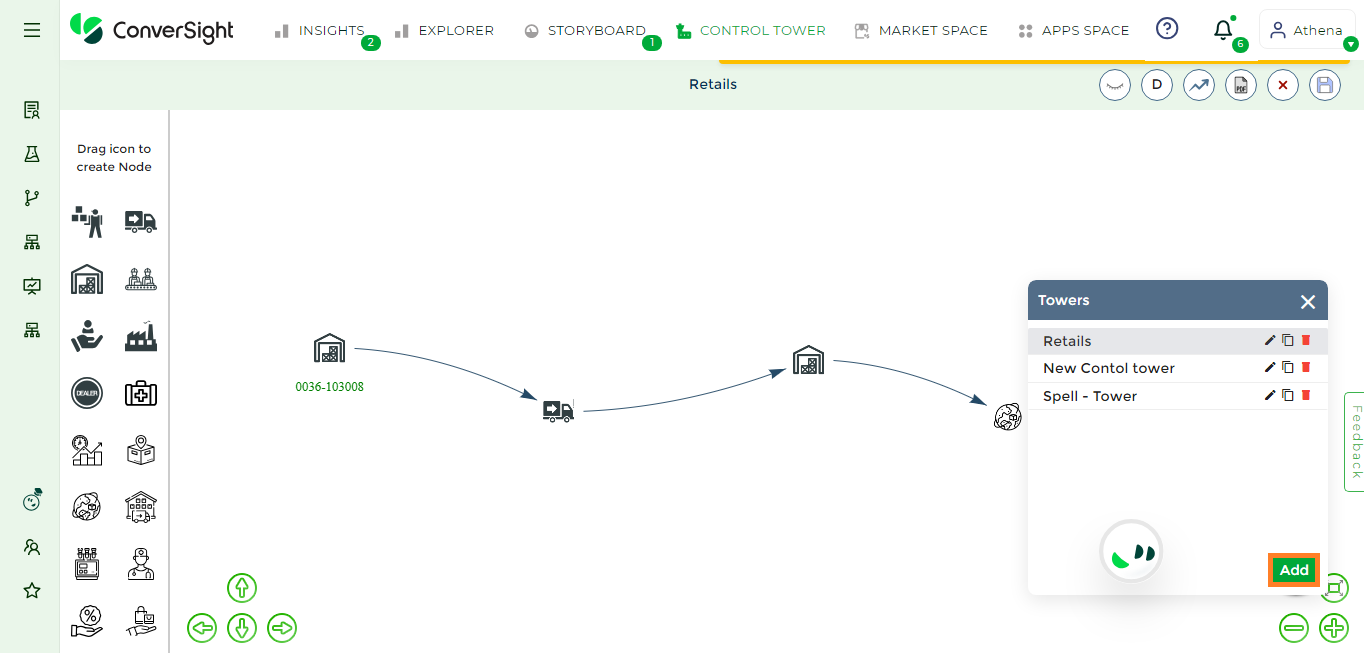
Creating Control Tower#
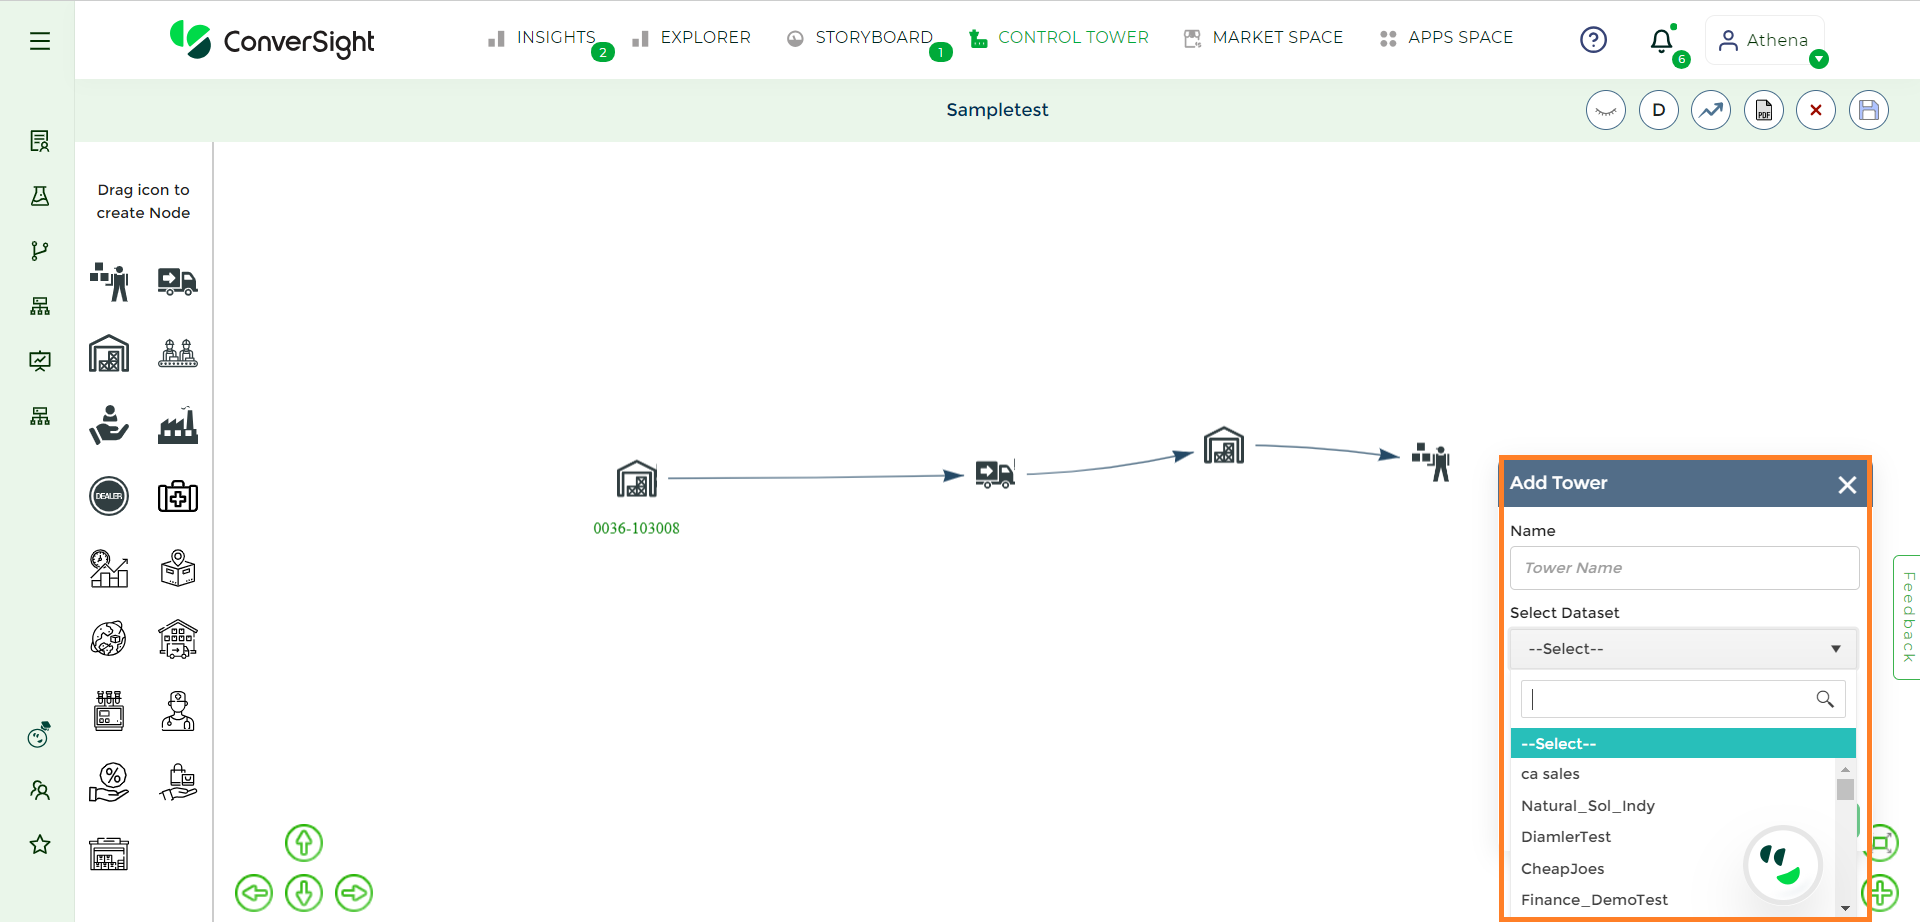
Creating Control Tower#
Step 5: Once the name and dataset information has been entered, proceed by clicking the Save button.
Saving Control Tower#
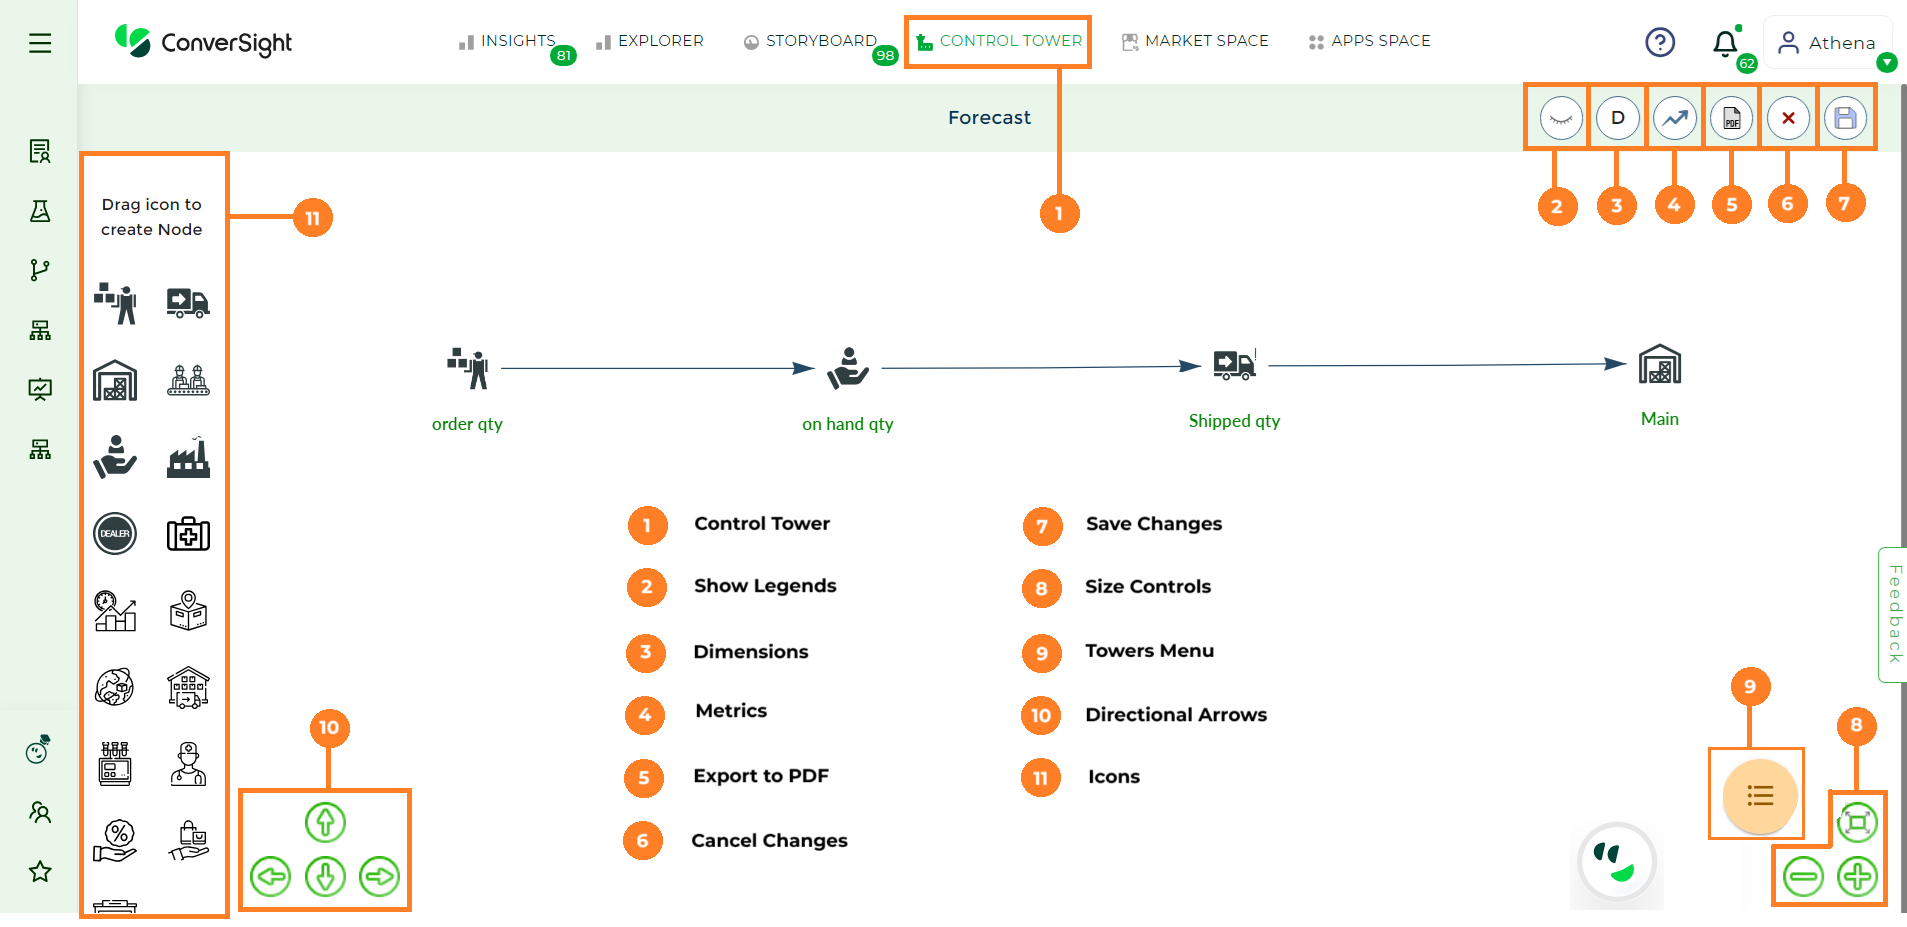
Step 6: Once the saving process is complete, a blank screen will be presented. Users can then utilize a drag-and-drop approach to construct the Control Tower, enhancing clarity by placing icons that represent their business.
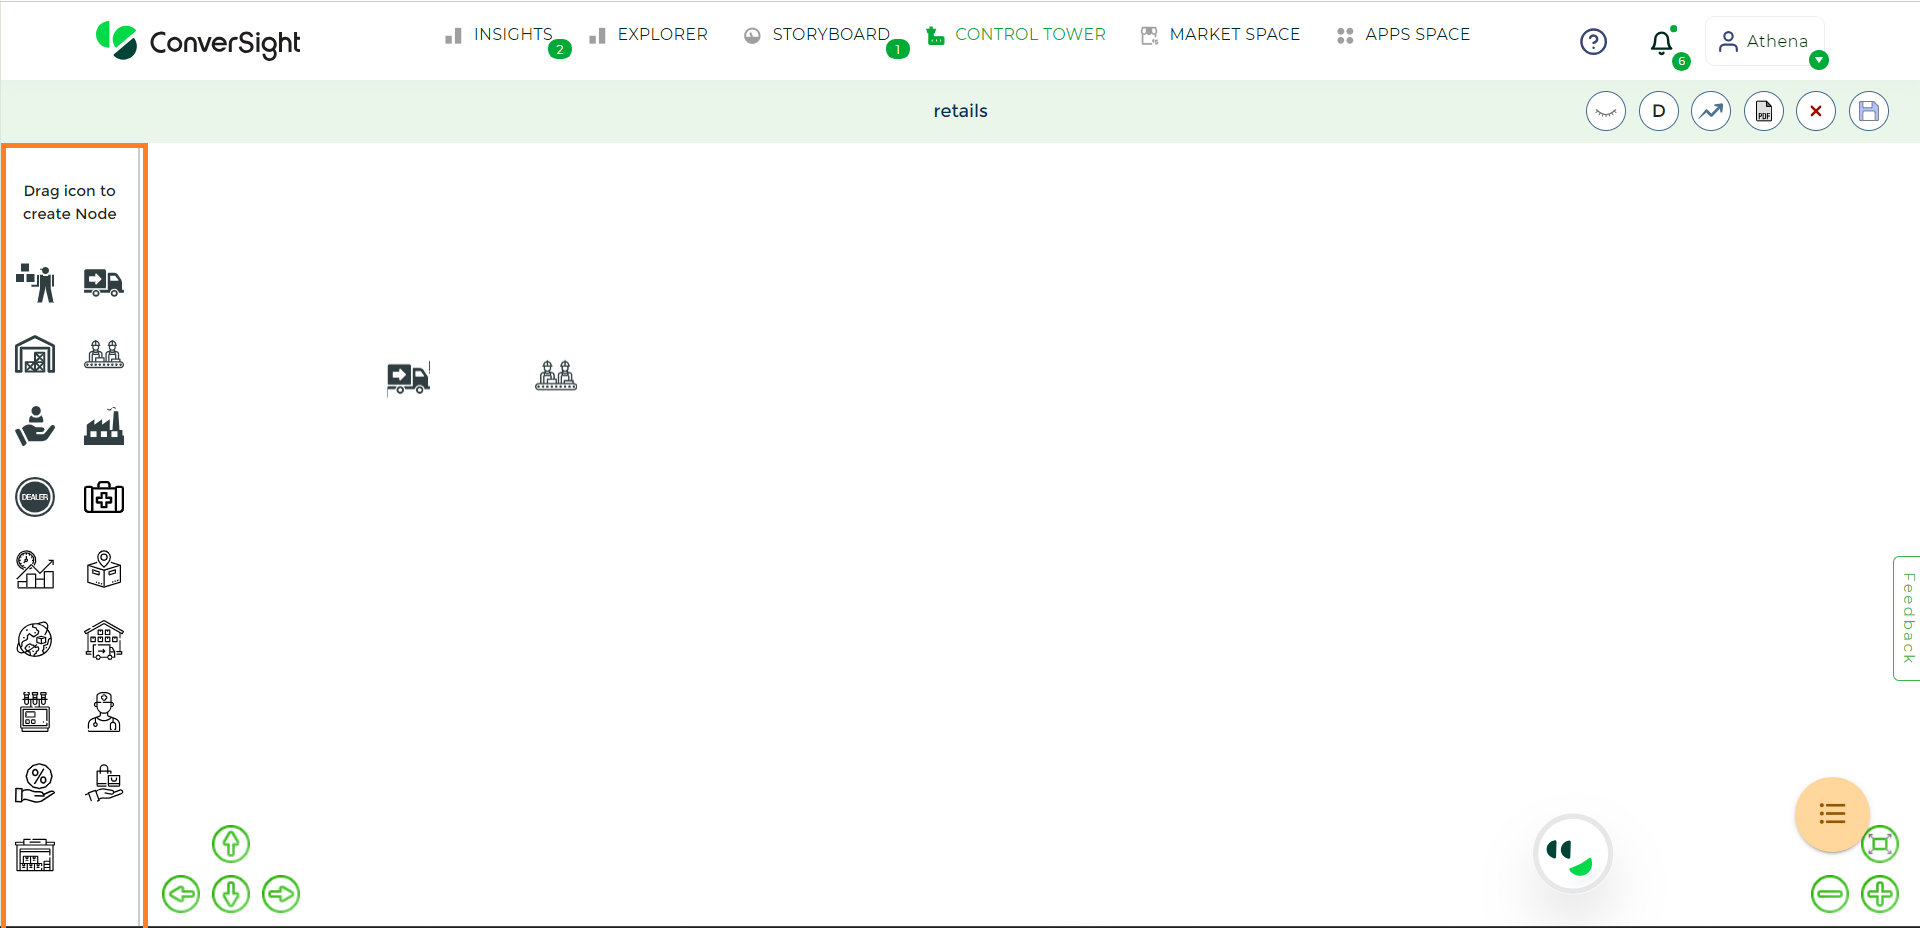
Nodes for building Control Tower#
Step 7: To establish connections between nodes, you can introduce edges. To include edges, just perform a right-click on a node and select the Add Edge choice. This facilitates the linkage between the nodes.
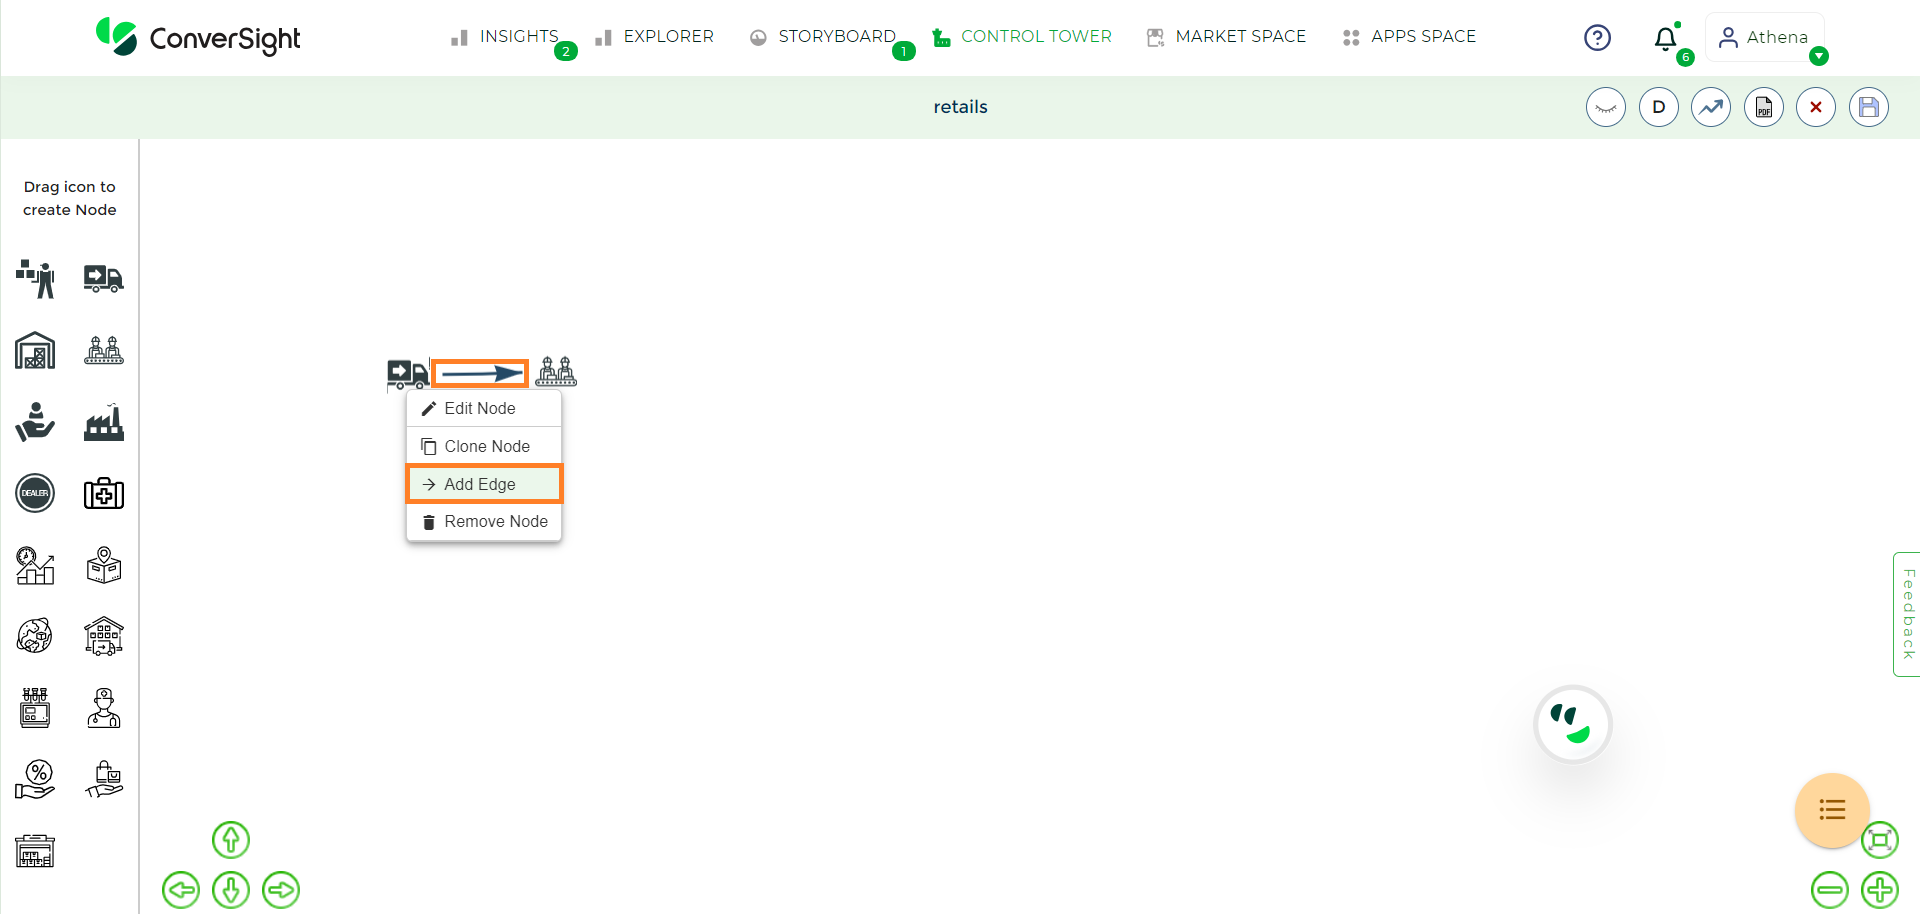
Adding edges in Control Tower#
The steps outlined above provide a foundational guide for establishing a Control Tower. For customizing nodes to match your unique requirements, the following section details the process of editing nodes accordingly.
To watch the video, click on Creating Control Tower.
Edit Node#
The Edit Node feature serves the purpose of personalizing the node and its attributes to align with your requirements. Now, let’s delve into the procedure of node customization.
You can edit the properties of the node by right clicking the node and choosing the Edit Node option.
Editing Node#
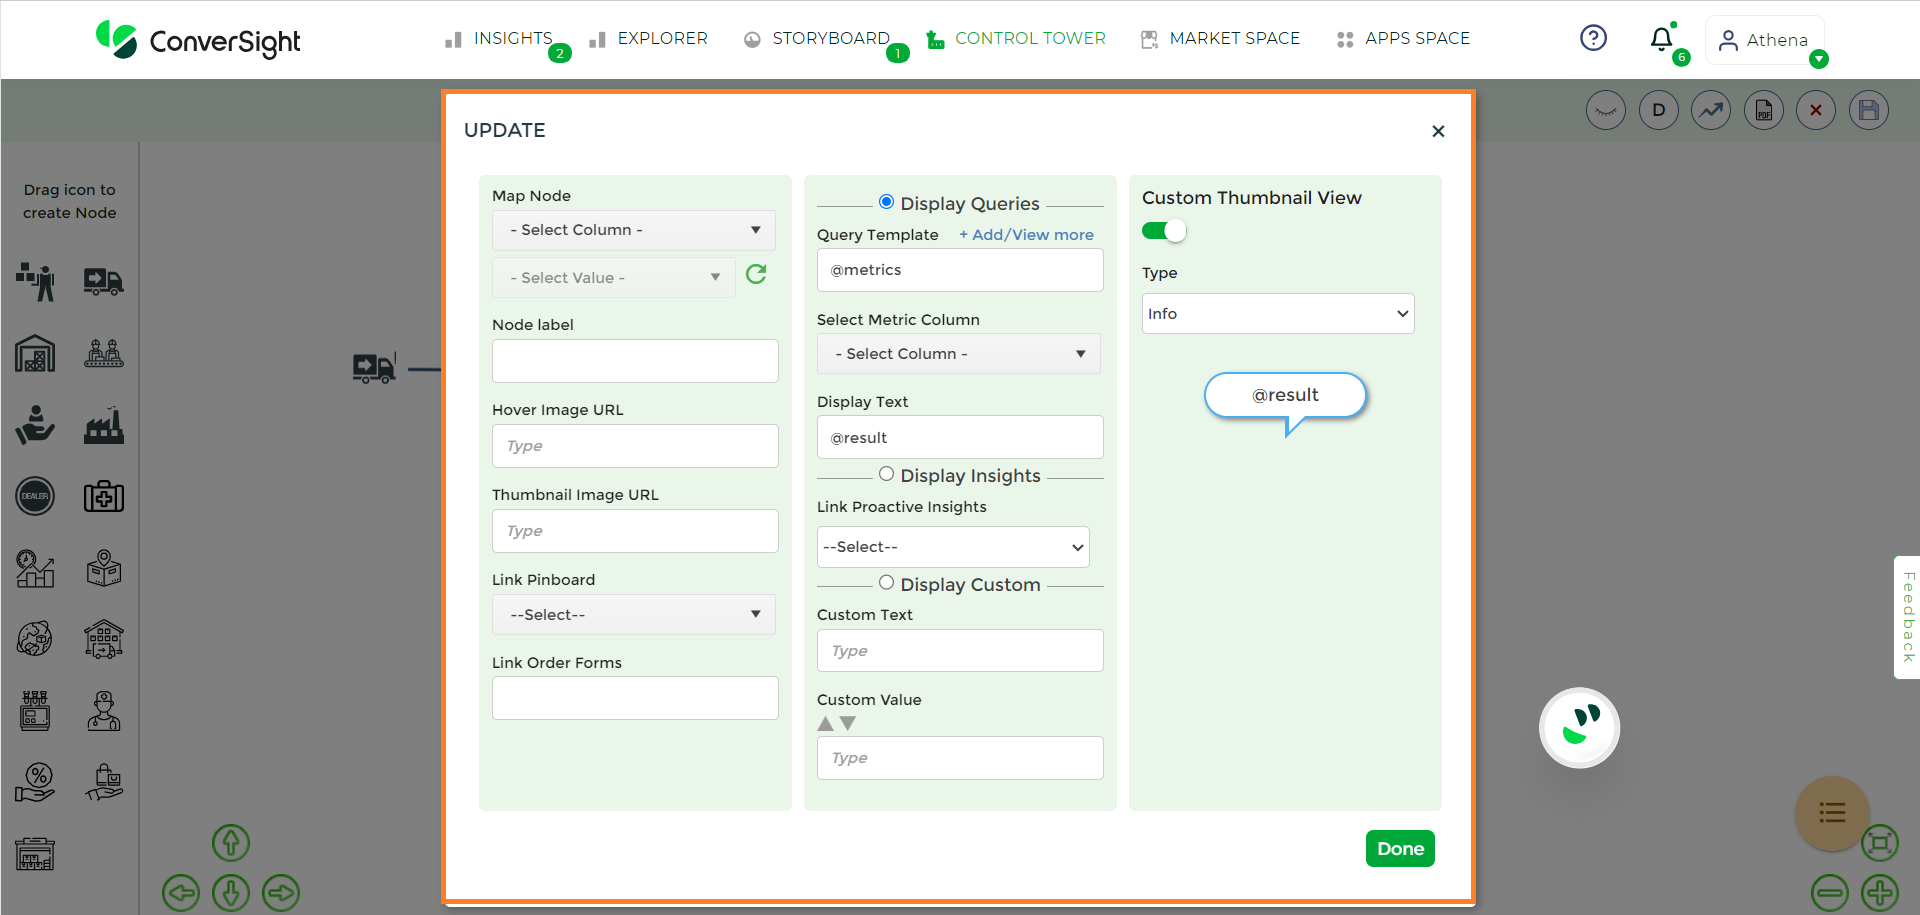
Editing Node properties#
This feature provides a comprehensive view, highlighting crucial information pertaining to each node. The table includes the following columns.
Modules |
Description |
|---|---|
Map Node |
You possess the ability to select both the column and its corresponding value from your dataset. |
Node Label |
You are presented with the option to input a label or alternatively, the chosen value from the column will be exhibited. |
Hover Image URL |
You have the capability to modify the image while in hover state by providing the URL. |
Thumbnail Image URL |
To modify the thumbnail image of a node, you can input the respective new URL. |
Link Pinboard |
You can connect to your node using the relevant storyboards you’ve generated, which will align with the items you have available. |
Link Order Forms |
You can connect your node to Forms in ConverSight based on your requirements. |
NOTE
You have the option to associate your node with either a Storyboard or a Form, but it's not possible to connect it to both at the same time.
Display Queries#
In the Display Query section, users have the ability to personalize the query, as well as select the column table value that should appear above the node.
Modules |
Description |
|---|---|
Query Template |
By default, the query template displays the categories of metrics. |
Select Metric Column |
You have the option to select the metric column from the chosen dataset. |
Display Text |
Enter the desired text for display. |
To include multiple queries within the node, click on the + Add/View more option, you can modify your created query and incorporate additional templates that align with your business needs.
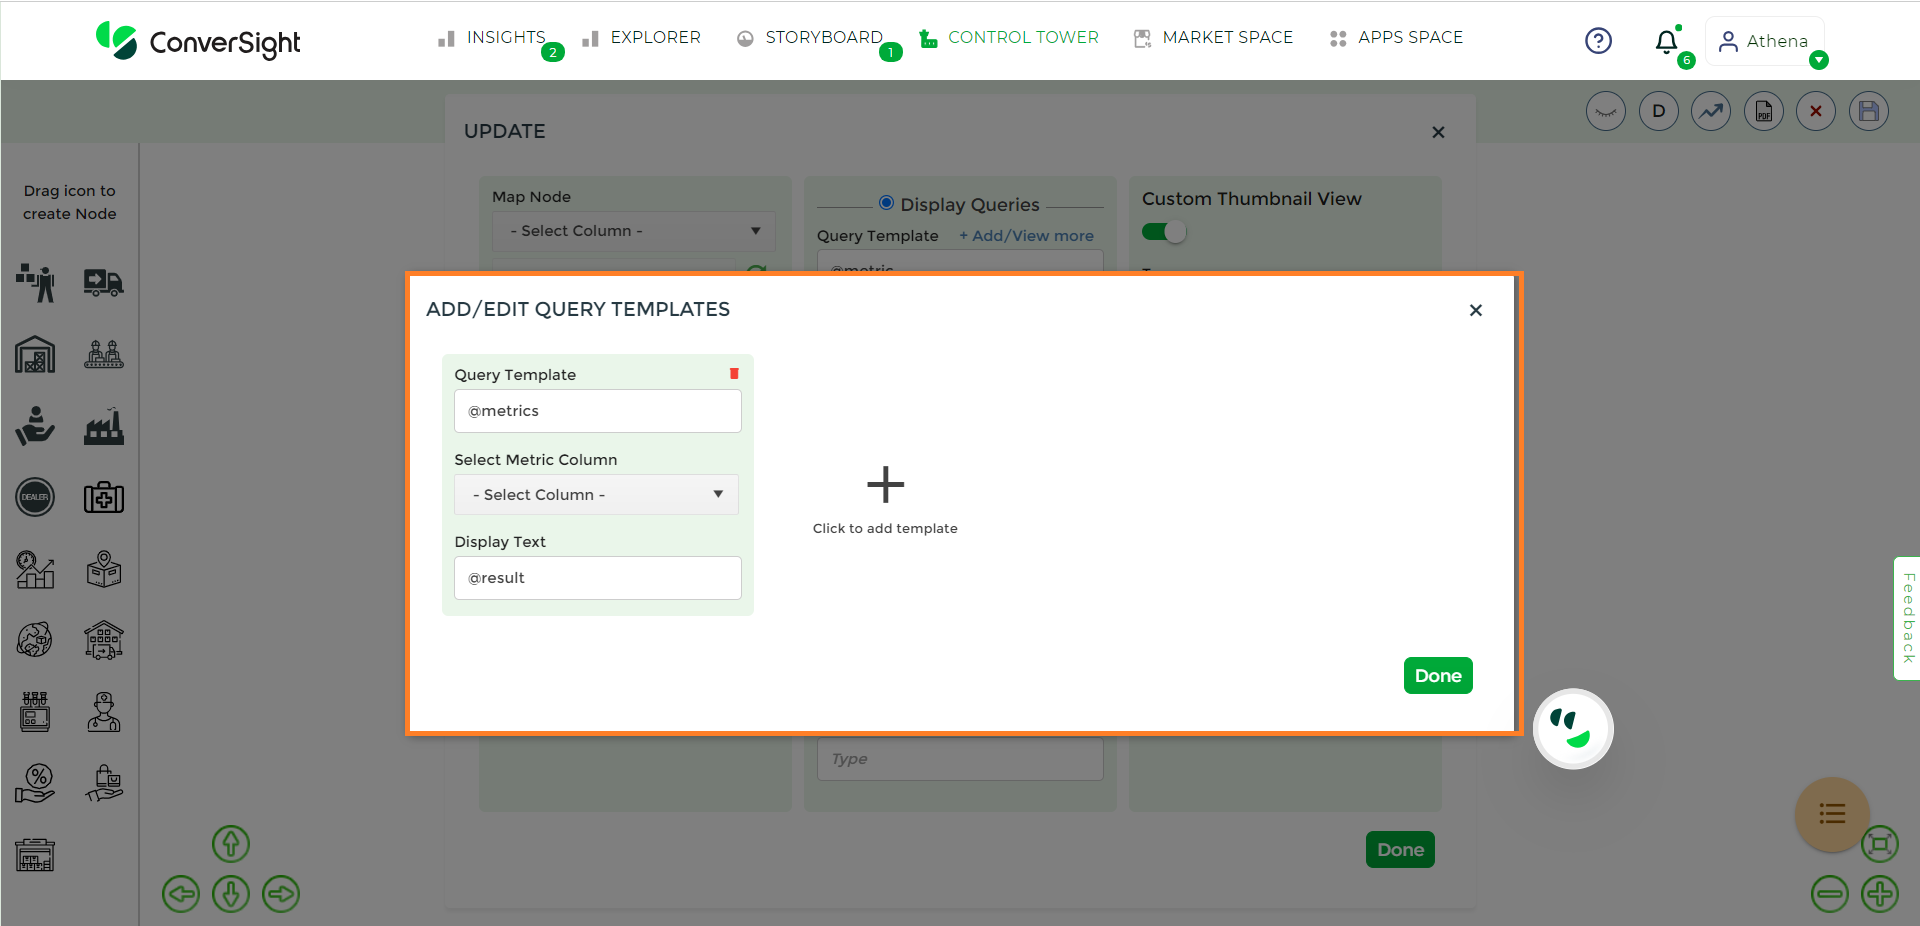
Add/Edit query templates#
Display Insights#
By selecting the Link Proactive Insights option, you can establish a connection between the node and the insights you’ve generated, ensuring alignment with your specific need.
Display Custom#
Opting for the Display Custom feature enables you to include your own text and specified values for showcasing. These custom elements remain unchanged for the selected node and can be manually modified if required.
Module |
Description |
|---|---|
Custom Text |
You have the option to customize the displayed text according to your preferences. This personalized text remains constant and doesn’t change. |
Custom Value |
You can input the value and additionally, the value can also be indicated with increment or decrement symbol. |
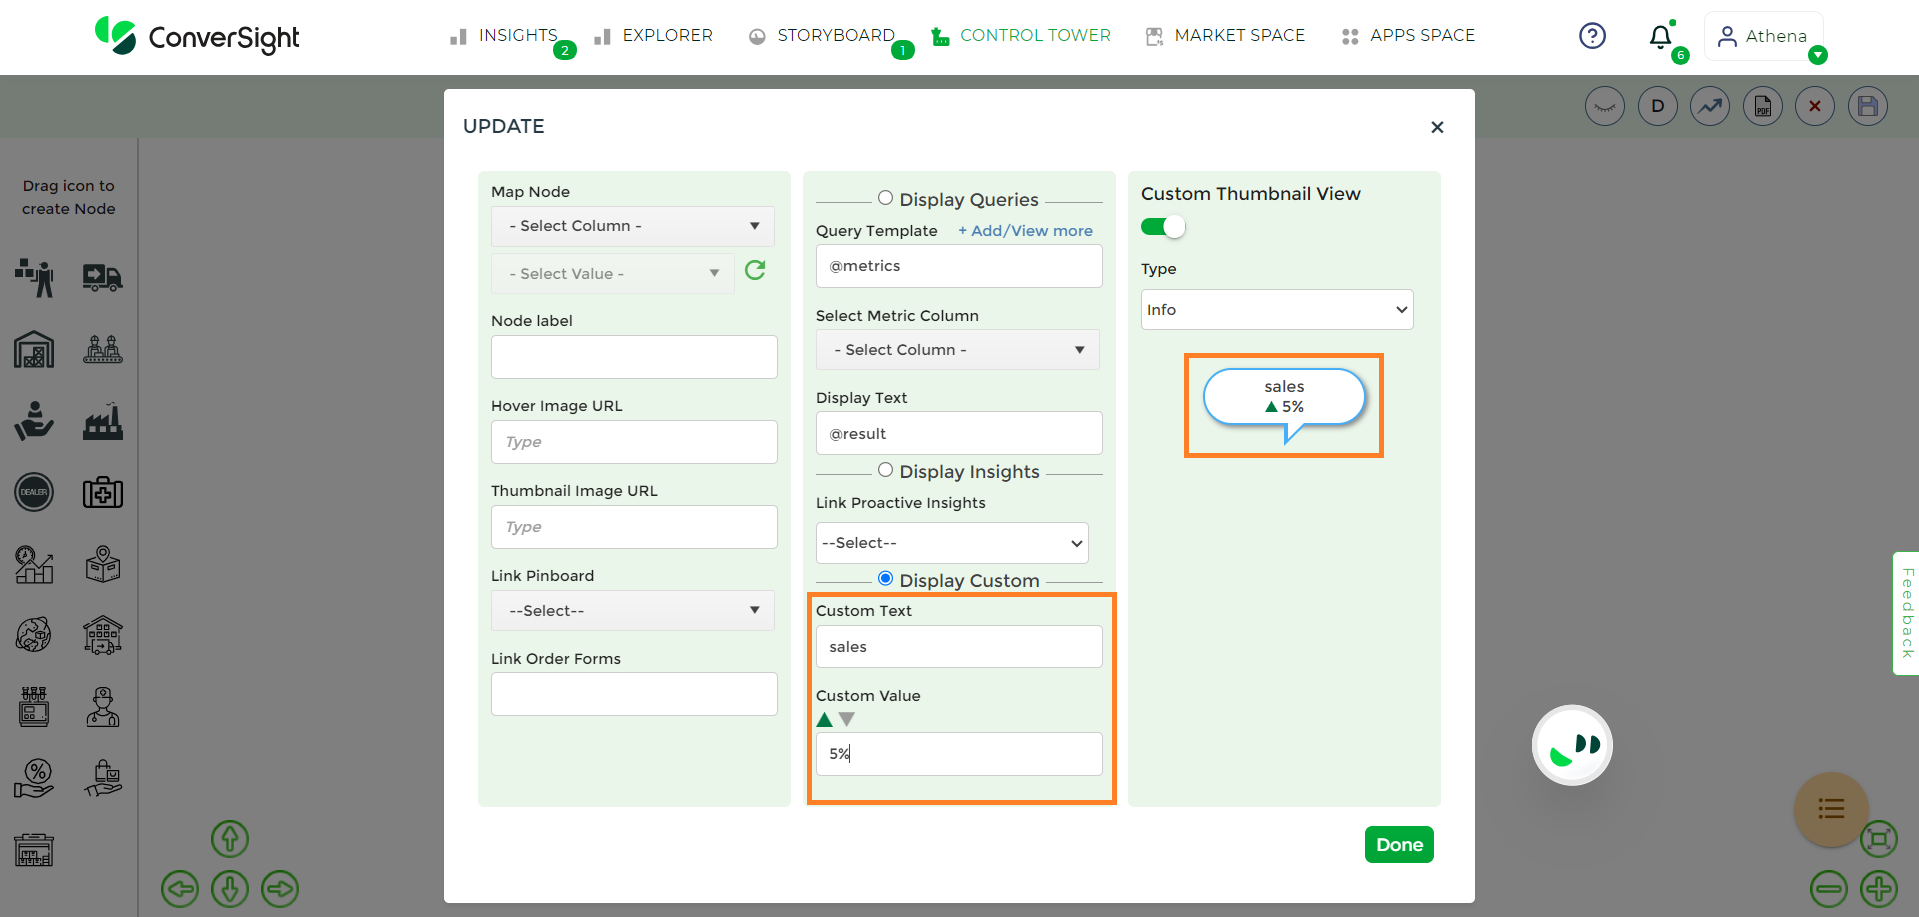
Display Custom#
Type#
The Type option primarily pertains to the color in which the display is presented. It provides you with the following:
Info: Selecting the info type will result in its display in blue color.
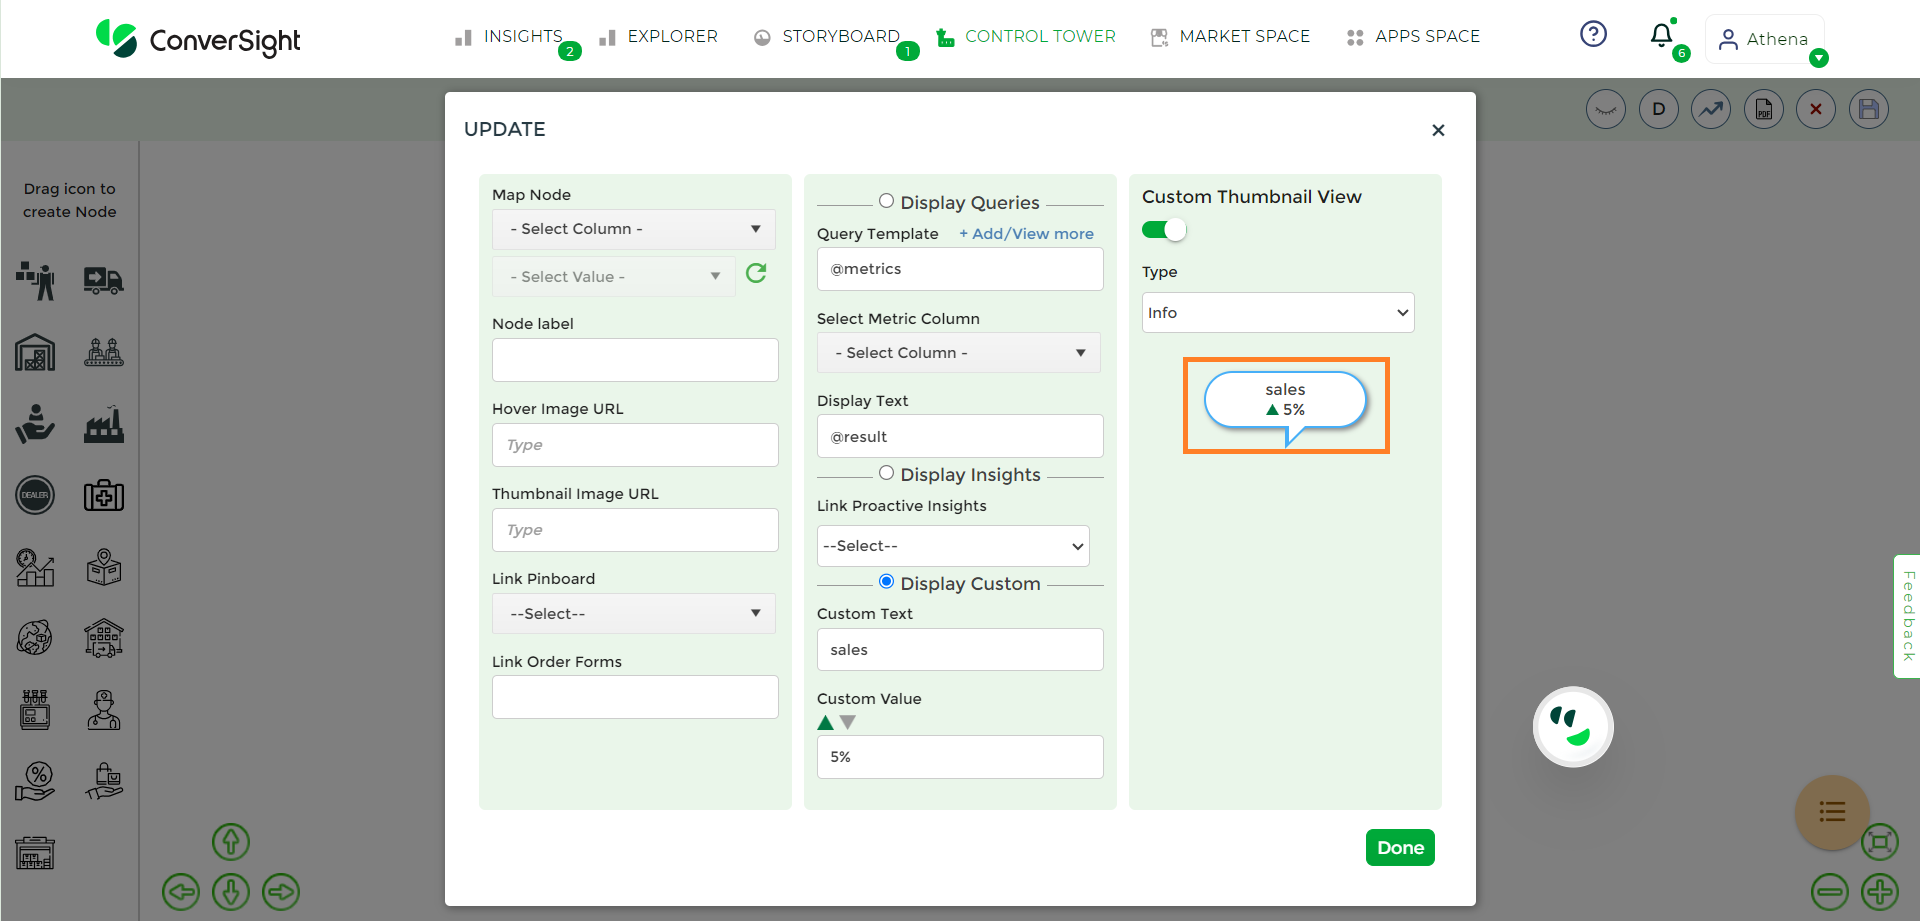
Type Info#
Warning: Selecting the warning type will result in its display in yellow color.

Type Warning#
Alert: Selecting the alert type will result in its display in red color.
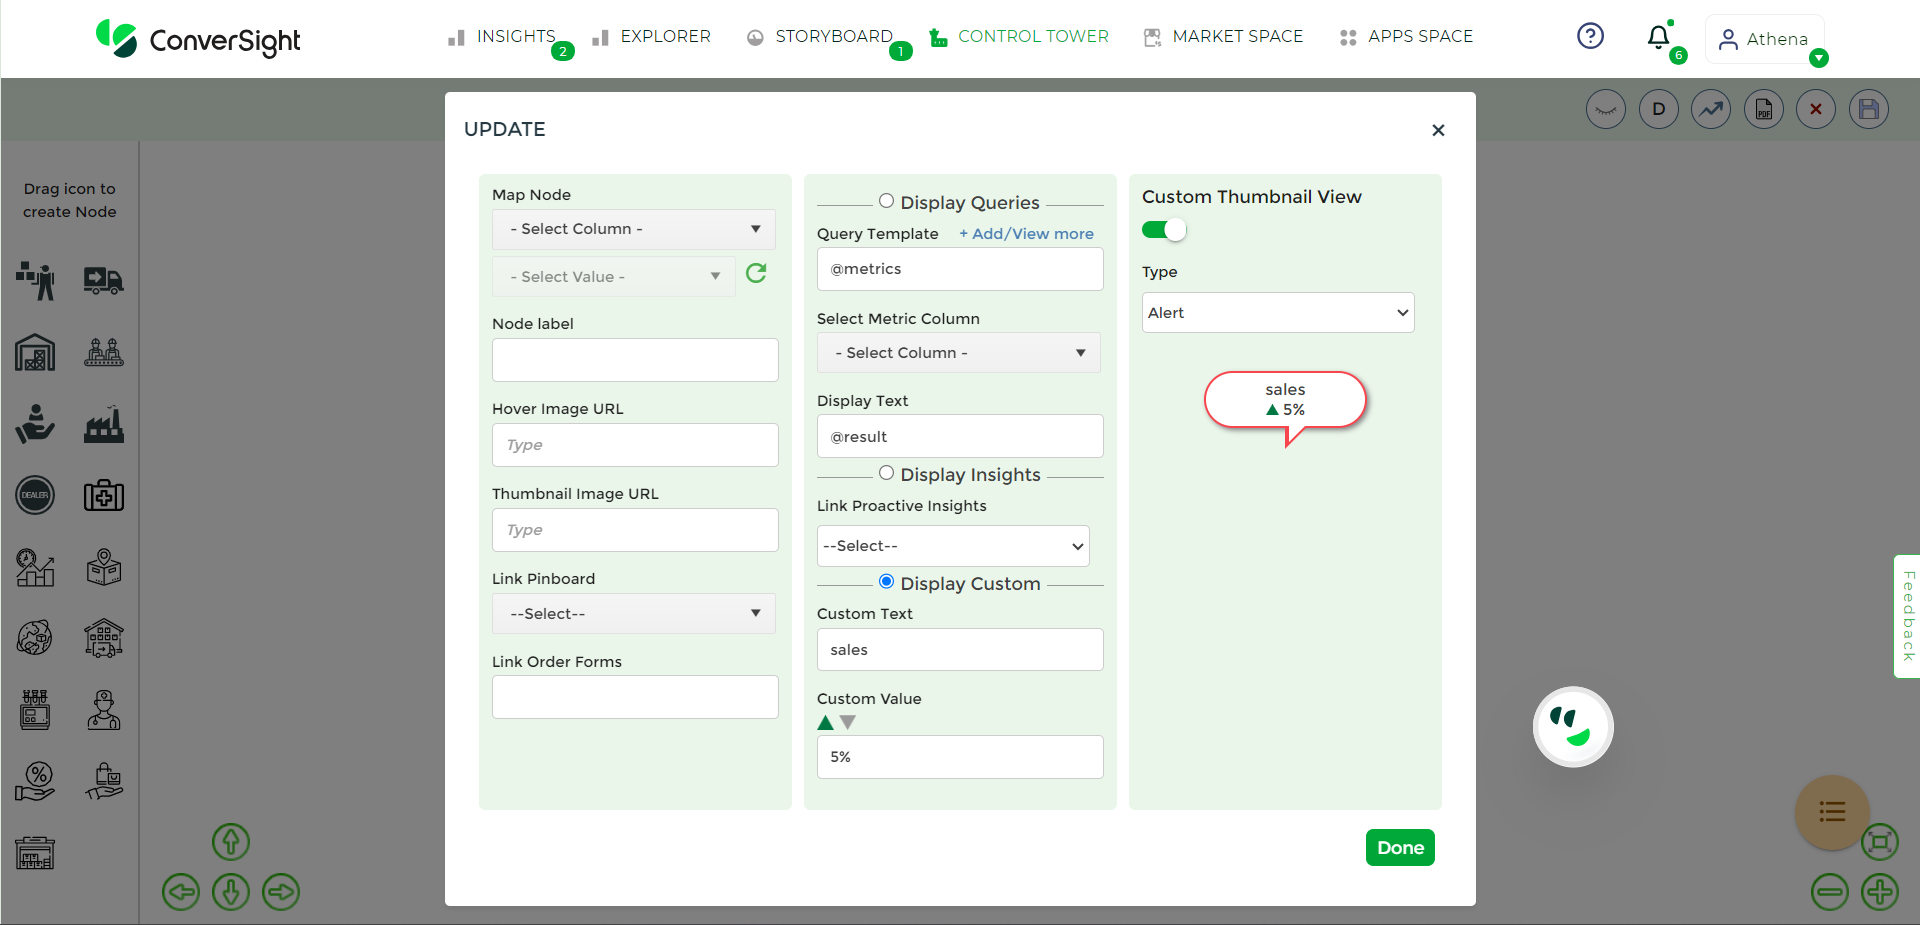
Type Alert#
After updating all the necessary columns, click the Done button to preserve the modifications.
Clone Node#
The Clone Node feature allows you to make an identical copy of a node while keeping its content and attributes intact. By right-clicking on the node you want to duplicate and choosing the Clone Node option, you can generate an exact replica of the selected node in a new instance.
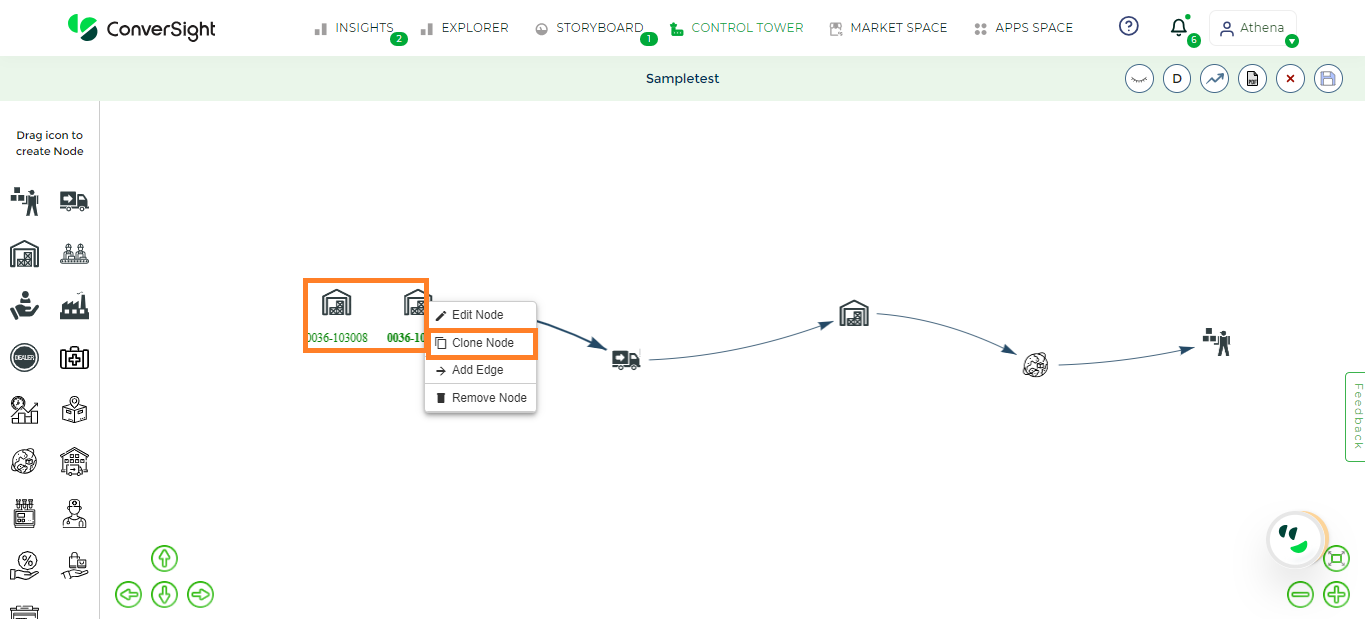
Clone Node#
Remove Node#
The Remove Node option allows you to delete or eliminate the node that you have selected. This action results in the removal of the chosen node from the structure, effectively eliminating its presence and any associated data.
Filters#
Applying filters serves to refine the information presented or analyzed by using specific criteria. Filters can be implemented within the Control Towers for each category. Upon selecting categories of dimensions or metrics, you are given the dataset’s relevant columns corresponding to the selected categories. From these columns, you can choose the ones where you wish to apply Filters.
Once you’ve chosen the categories, click on the Filter icon to implement the filters.
For applying filters to dimensions, you are provided with the selected columns, where you can choose the values presented in the columns.
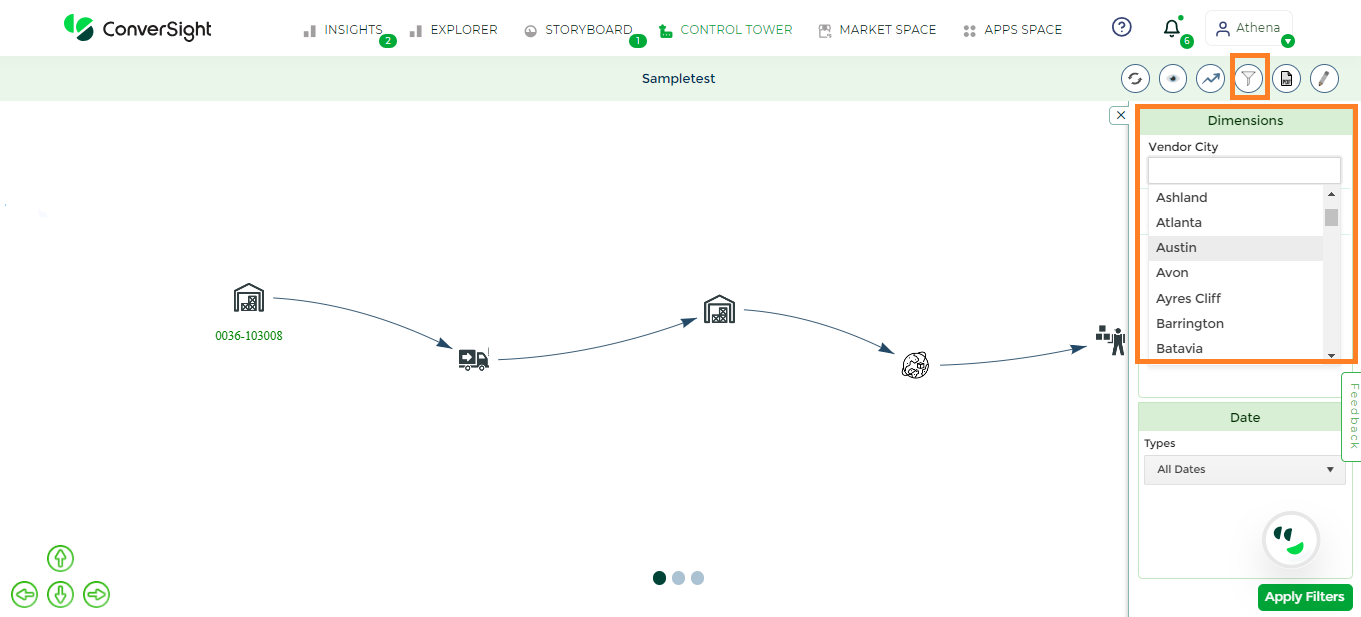
Dimensions#
For applying filters to dates, you can choose from the types that list the dates. Additionally, you can customize the dates as needed.
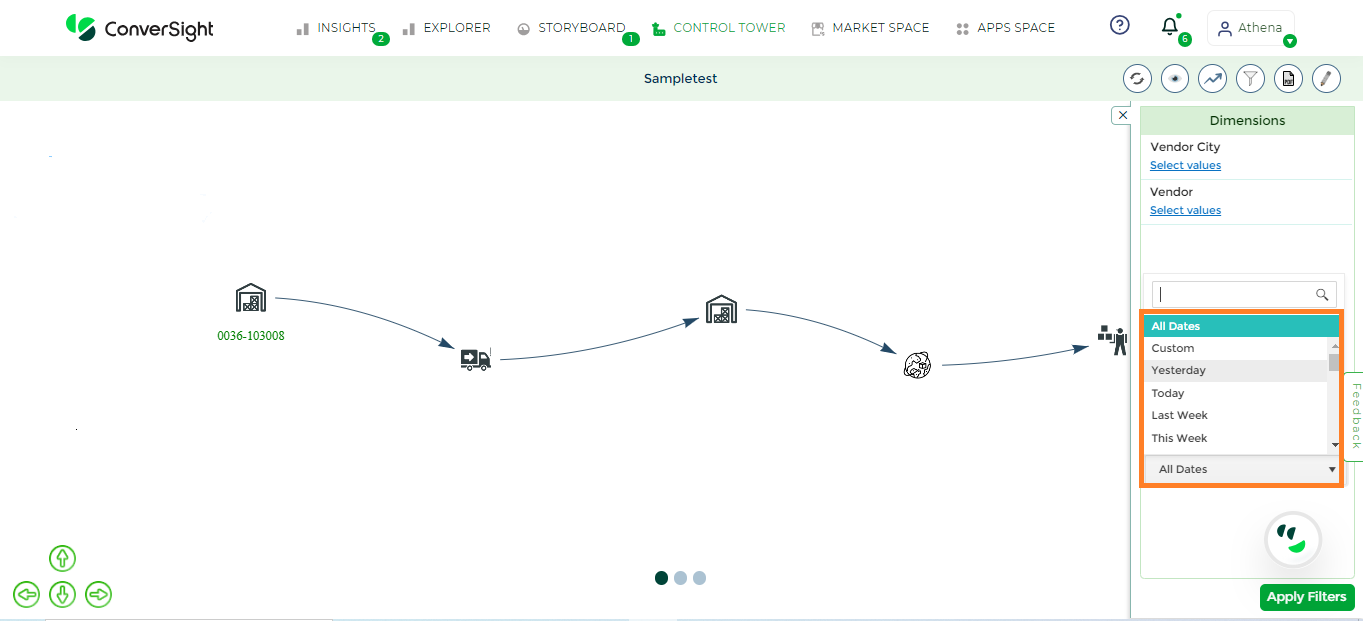
Date#
For applying filters to metrics, you’ll see the chosen metrics column listed. By clicking on the column, the filter will be applied. Clicking on Apply Filters saves the changes made to the filters and displays the results based on the applied filters.
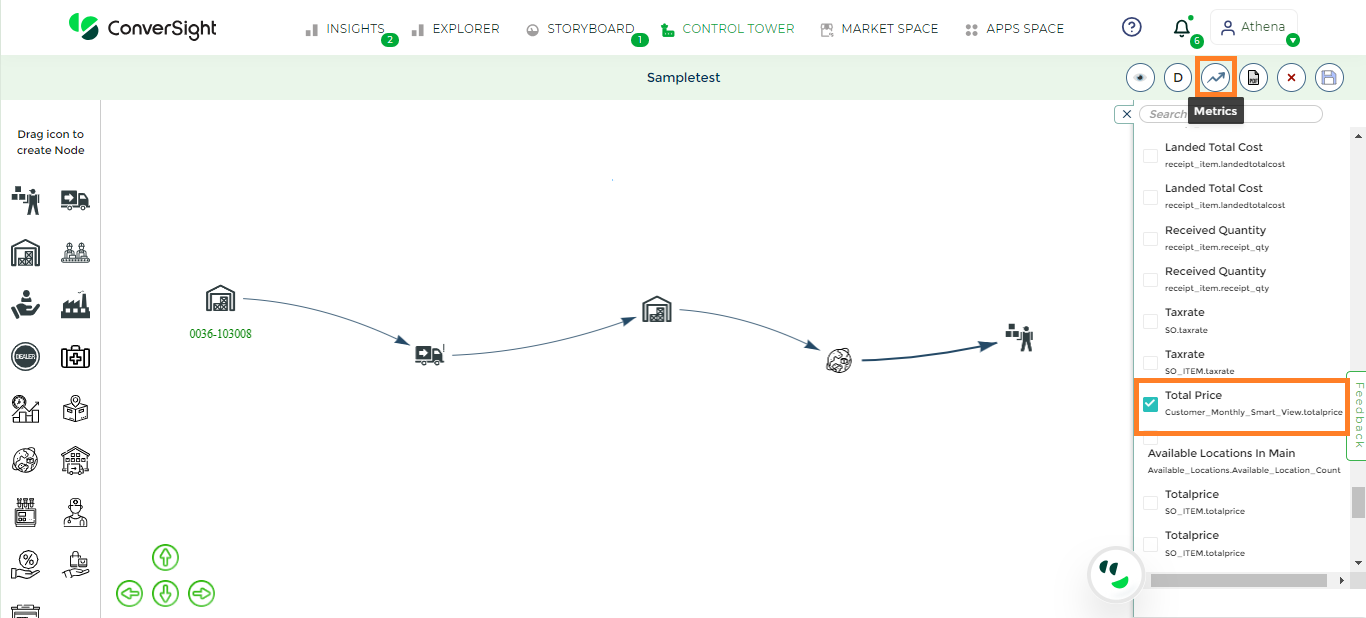
Metrics Filter#
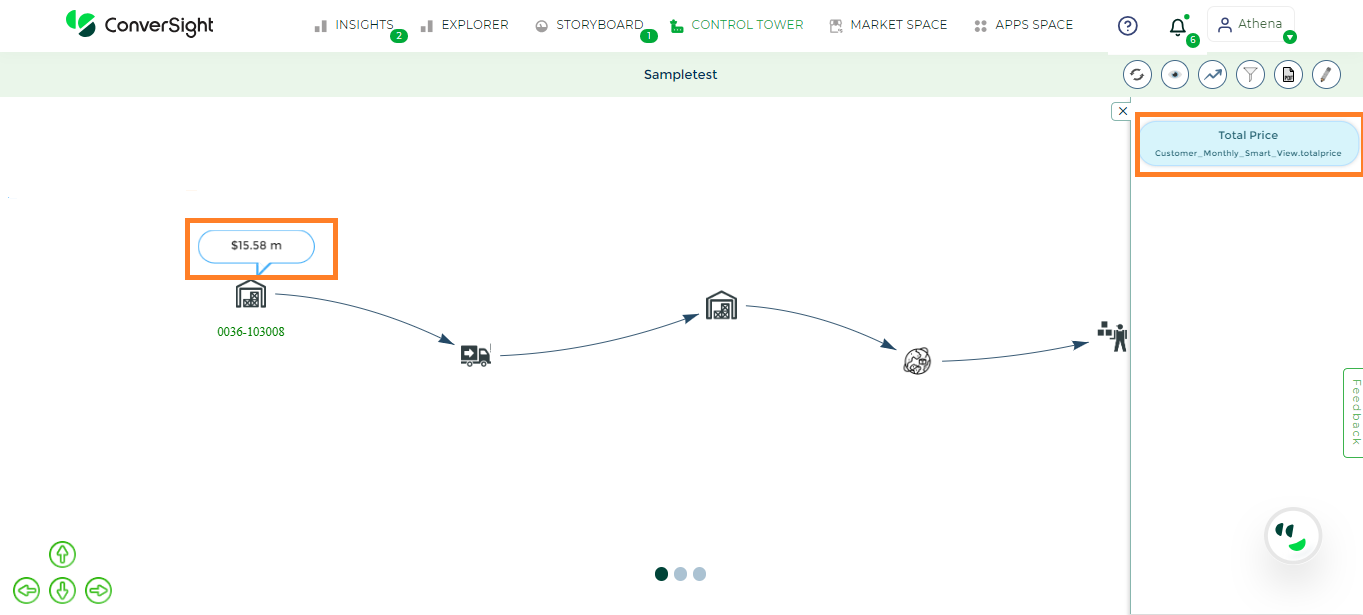
Metrics#
Show Legends#
Enabling the Show Legends option allows you to view the applied filters. This feature provides a clear and organized presentation of the implemented filters, offering transparency into the specific criteria used to analyze the data.
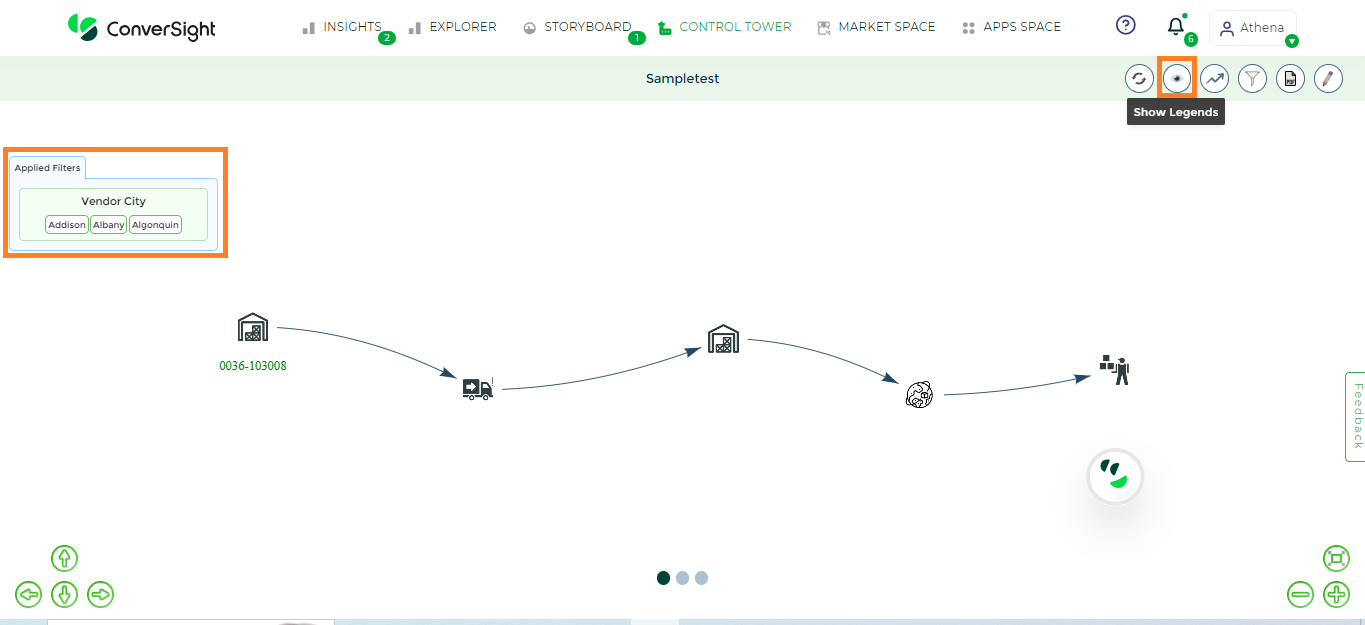
Show Legends#
Export to PDF#
The Export to PDF option allows you to convert the reports to a static, fixed-format version, that can be easily shared, printed and viewed by others.
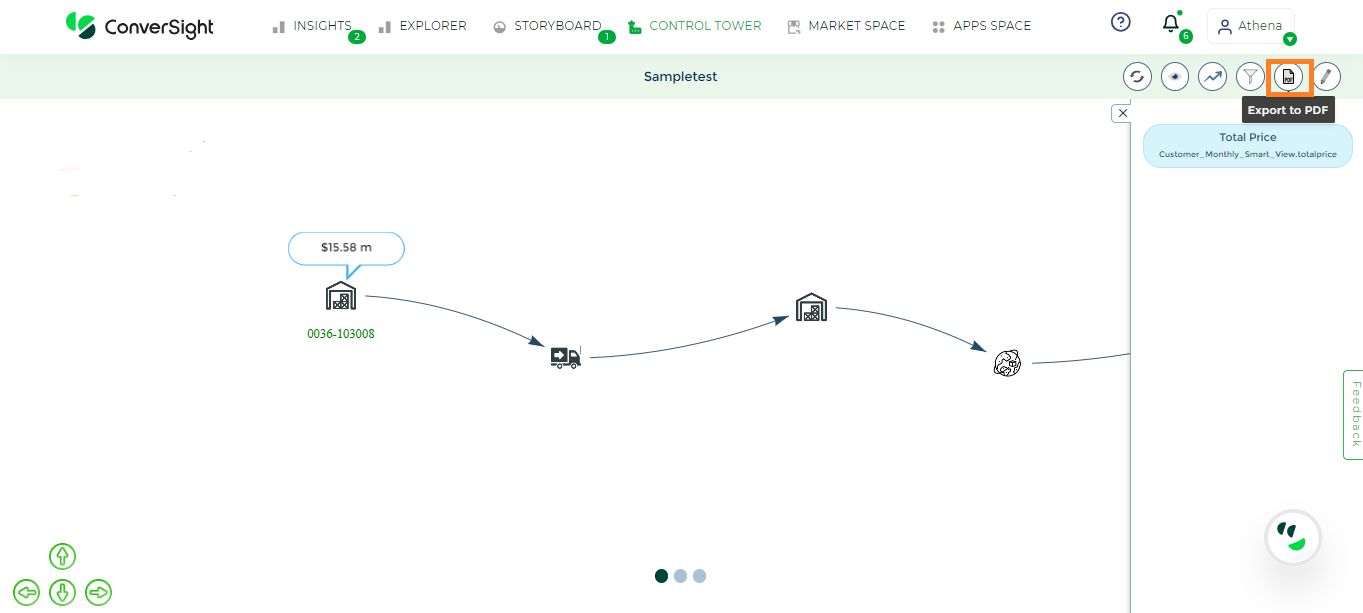
Export to PDF#
Visual Settings#
The directional arrows, including left, right, up and down, offer you the tools to modify the placement of your Control Tower, aligning it precisely with your preferred visibility. These arrows enable you to shift the Control Tower’s position, ensuring optimal observation of pertinent elements for an effective perspective.
The minus, plus and reset icons offer you precise control over adjusting your Control Towers. The minus icon reduces the size, the plus icon increases it and the reset icon restores proper alignment. Utilizing these icons allows you to fine-tune the configuration and to align your Control Towers accurately.
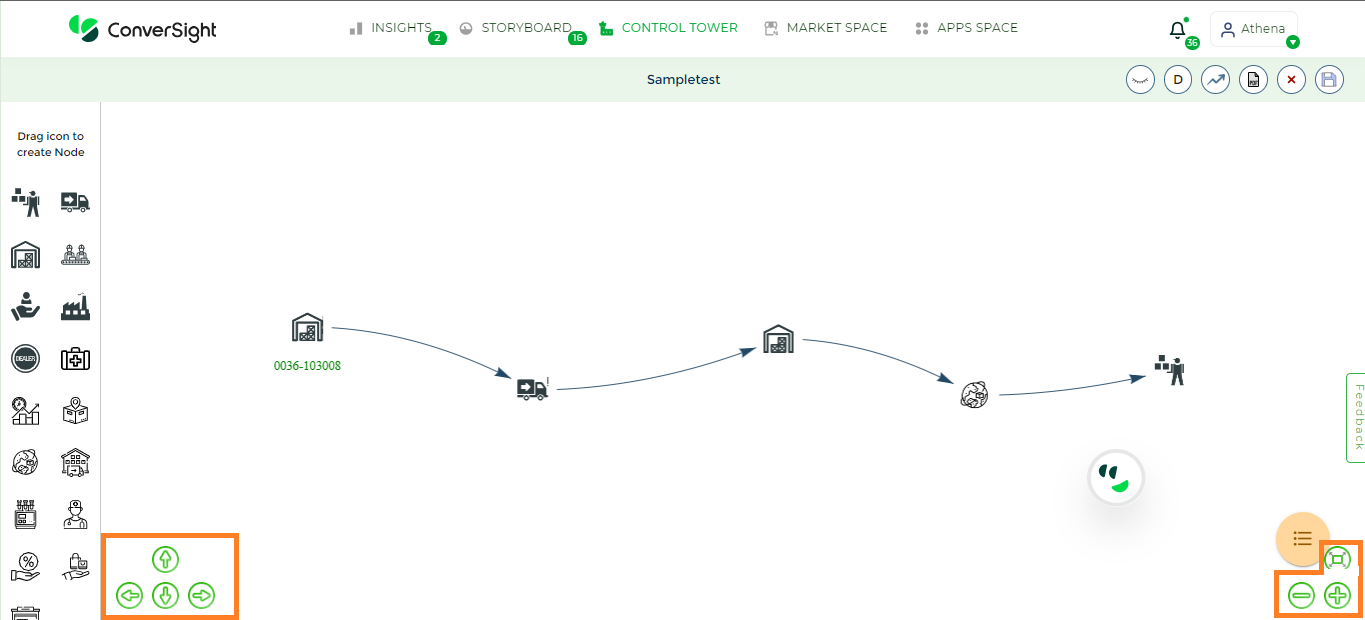
Visual Settings#
Management of Control Tower#
The Towers menu is designed to offer users a versatile array of management options, catering to various operational needs. These management capabilities encompass a range of essential actions, including:
Edit
Clone
Delete
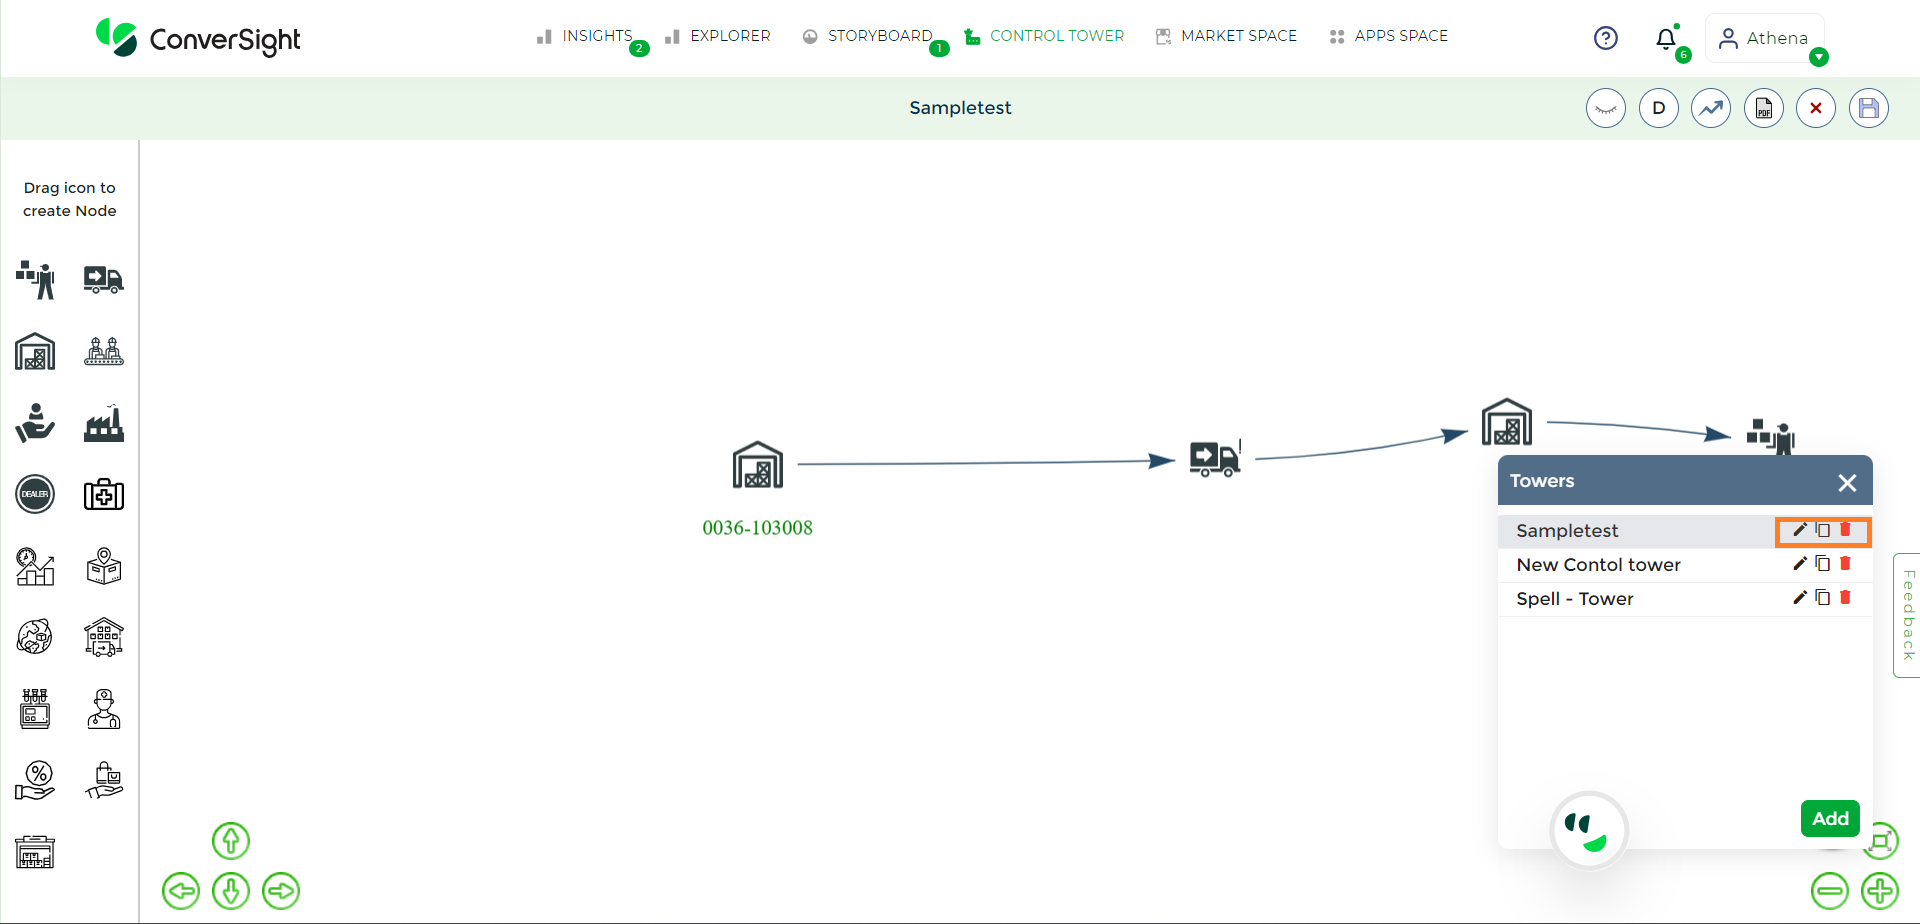
Management of Control Tower#
Edit Tower#
With the Edit feature, you can alter the name of the Control Tower you’ve established. However, it’s important to note that editing the dataset within the created Control Tower is not allowed. Yet, an alternative approach is that you can clone the Control Tower and then proceed to edit the dataset as needed.
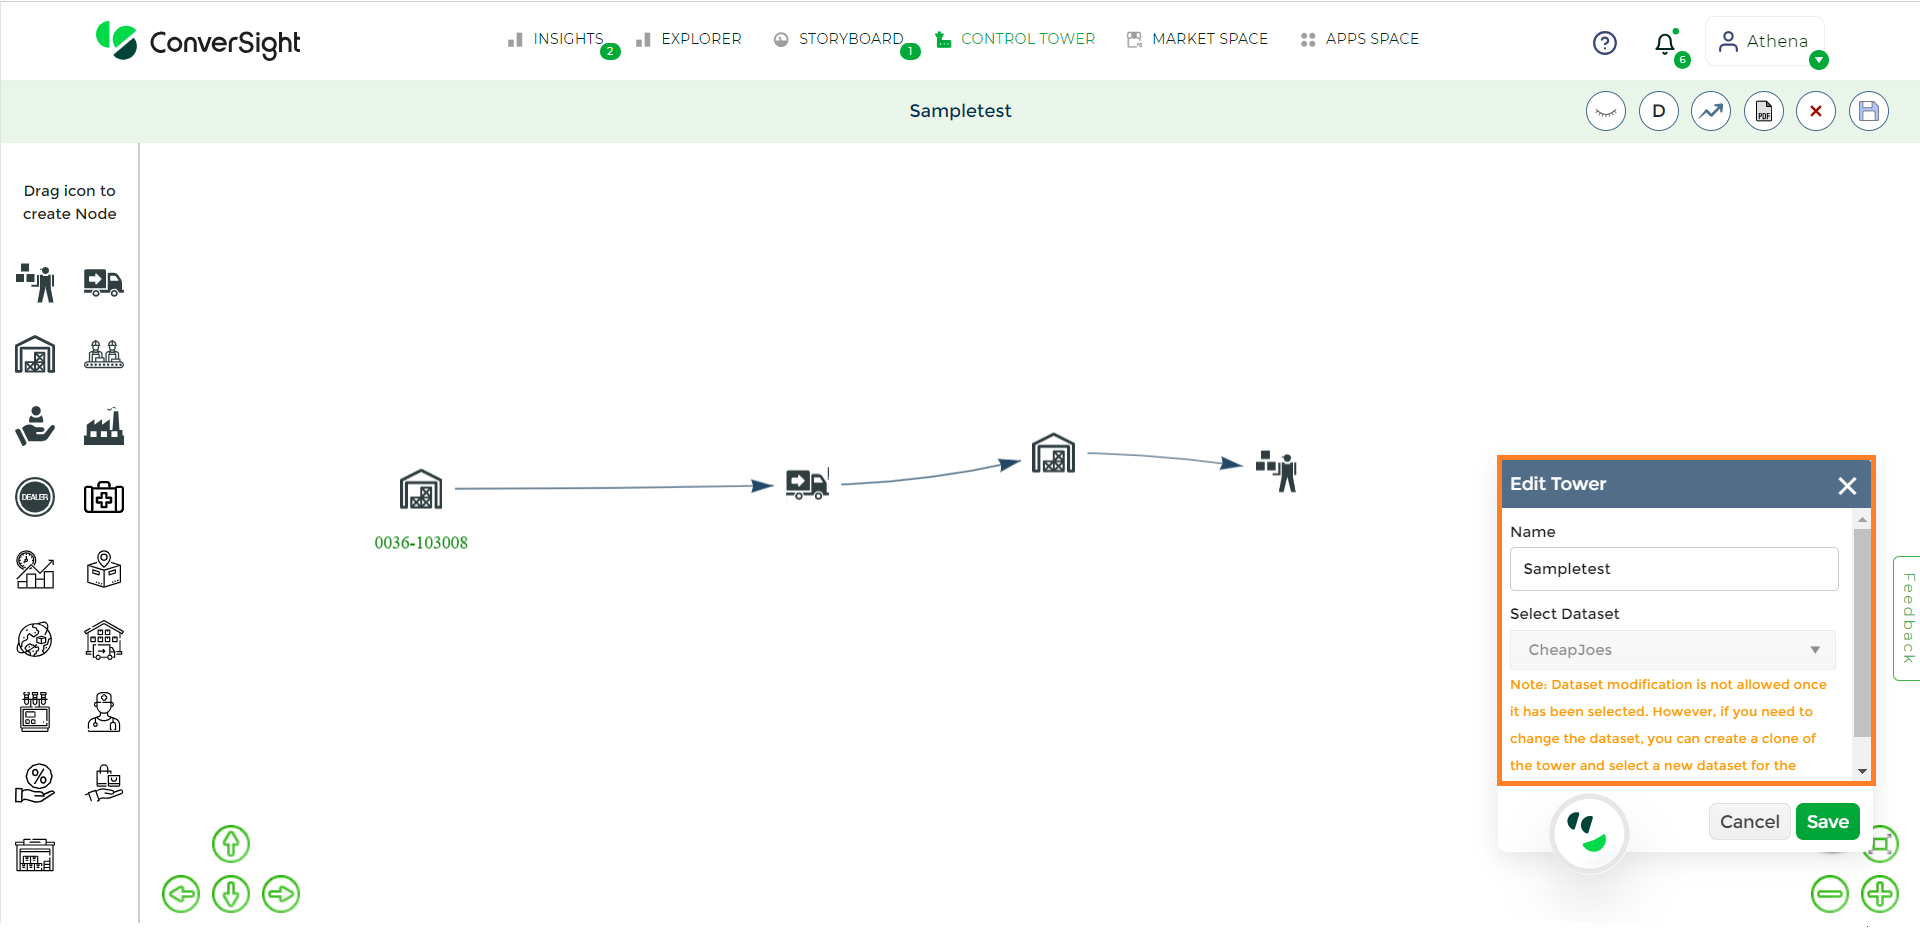
Edit Tower#
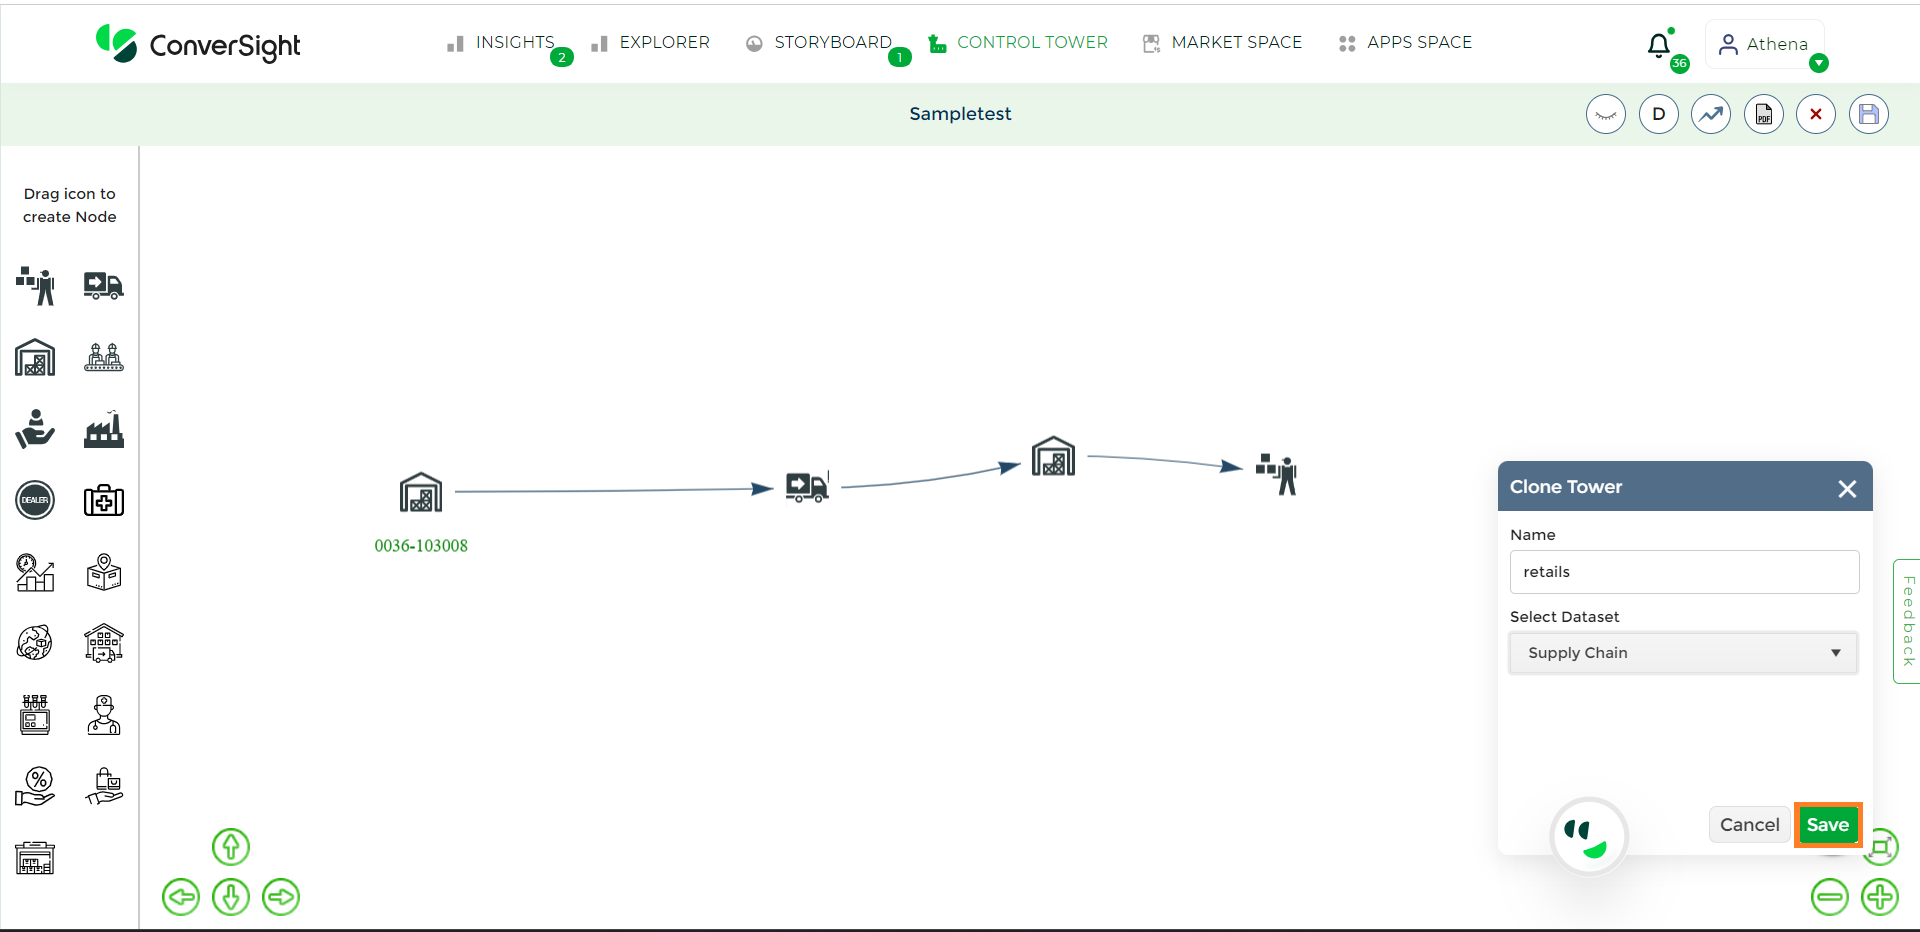
Clone Tower#
The capability of Clone Tower empowers you to create an exact replica of an existing Control Tower. The Clone option offers the subsequent choices for duplicating a Control Tower:
Type |
Description |
|---|---|
Clone Diagram |
You are indeed able to create and also edit the dataset from the cloned Control Tower. |
Clone Diagram with actions |
You can create a new Control Tower with the same dataset. |
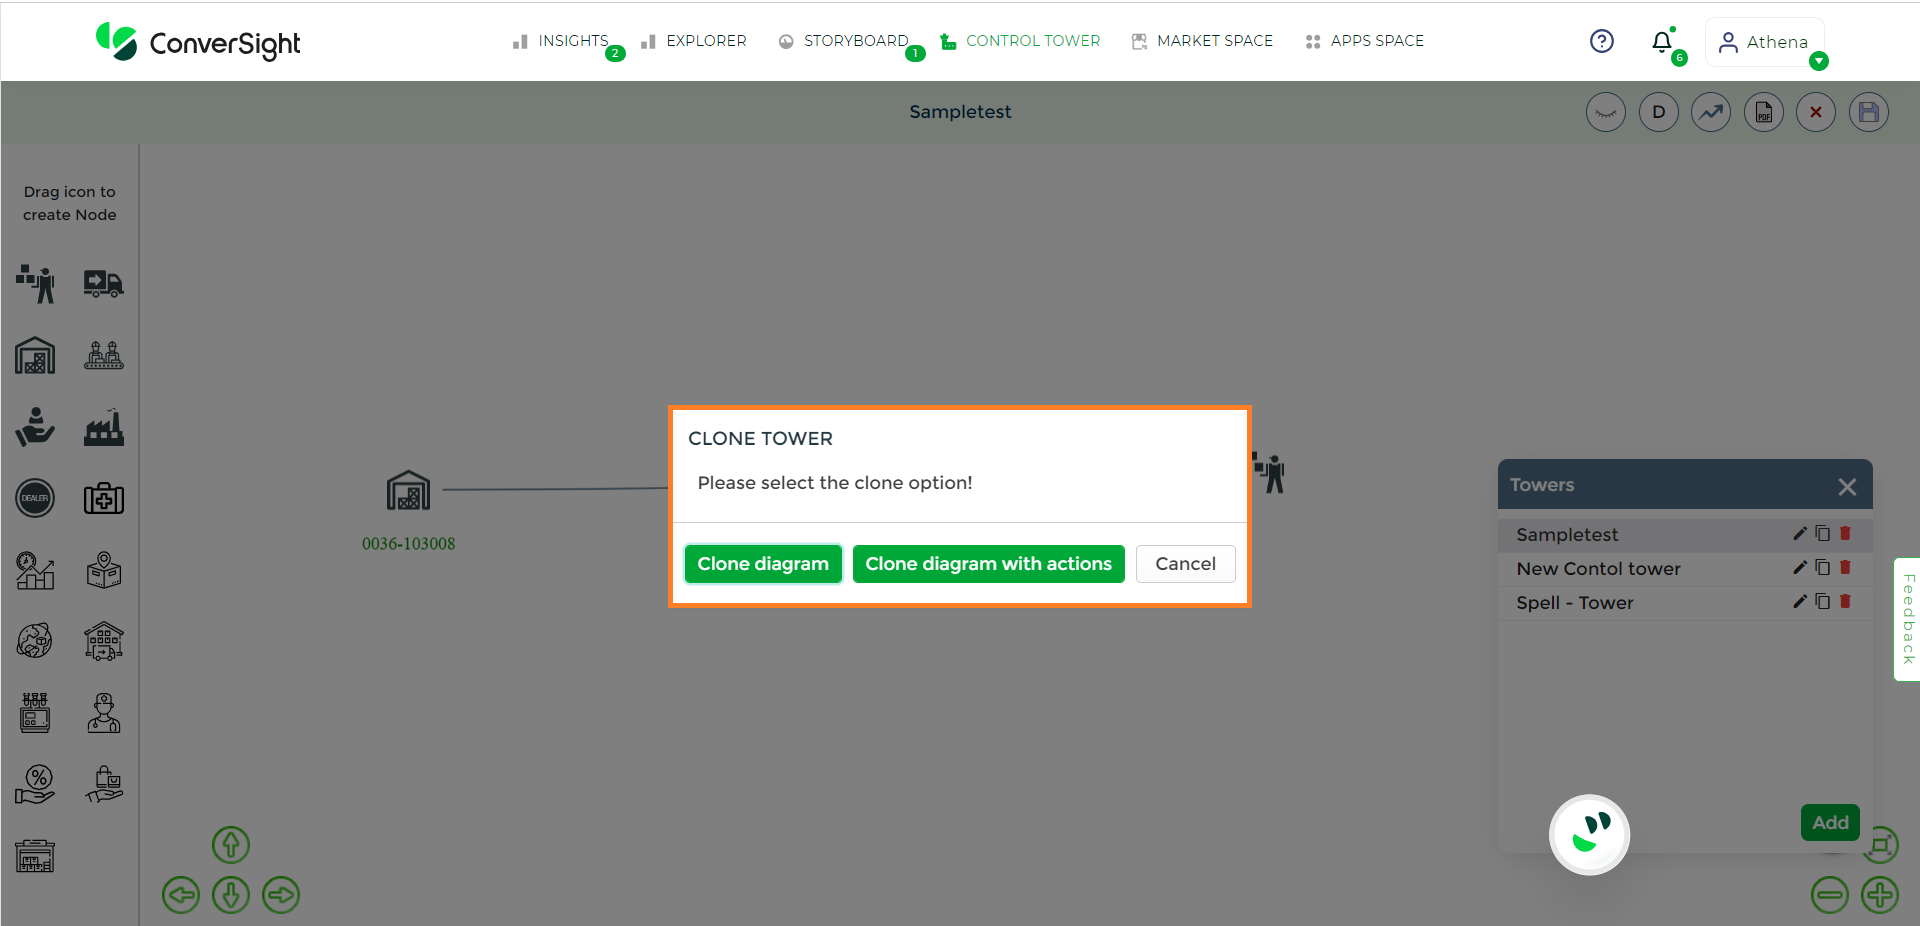
Clone Tower#
Delete Tower#
The Delete option enables the full removal of the Control Tower, including all associated data and settings, necessitating careful consideration due to its irreversible nature.
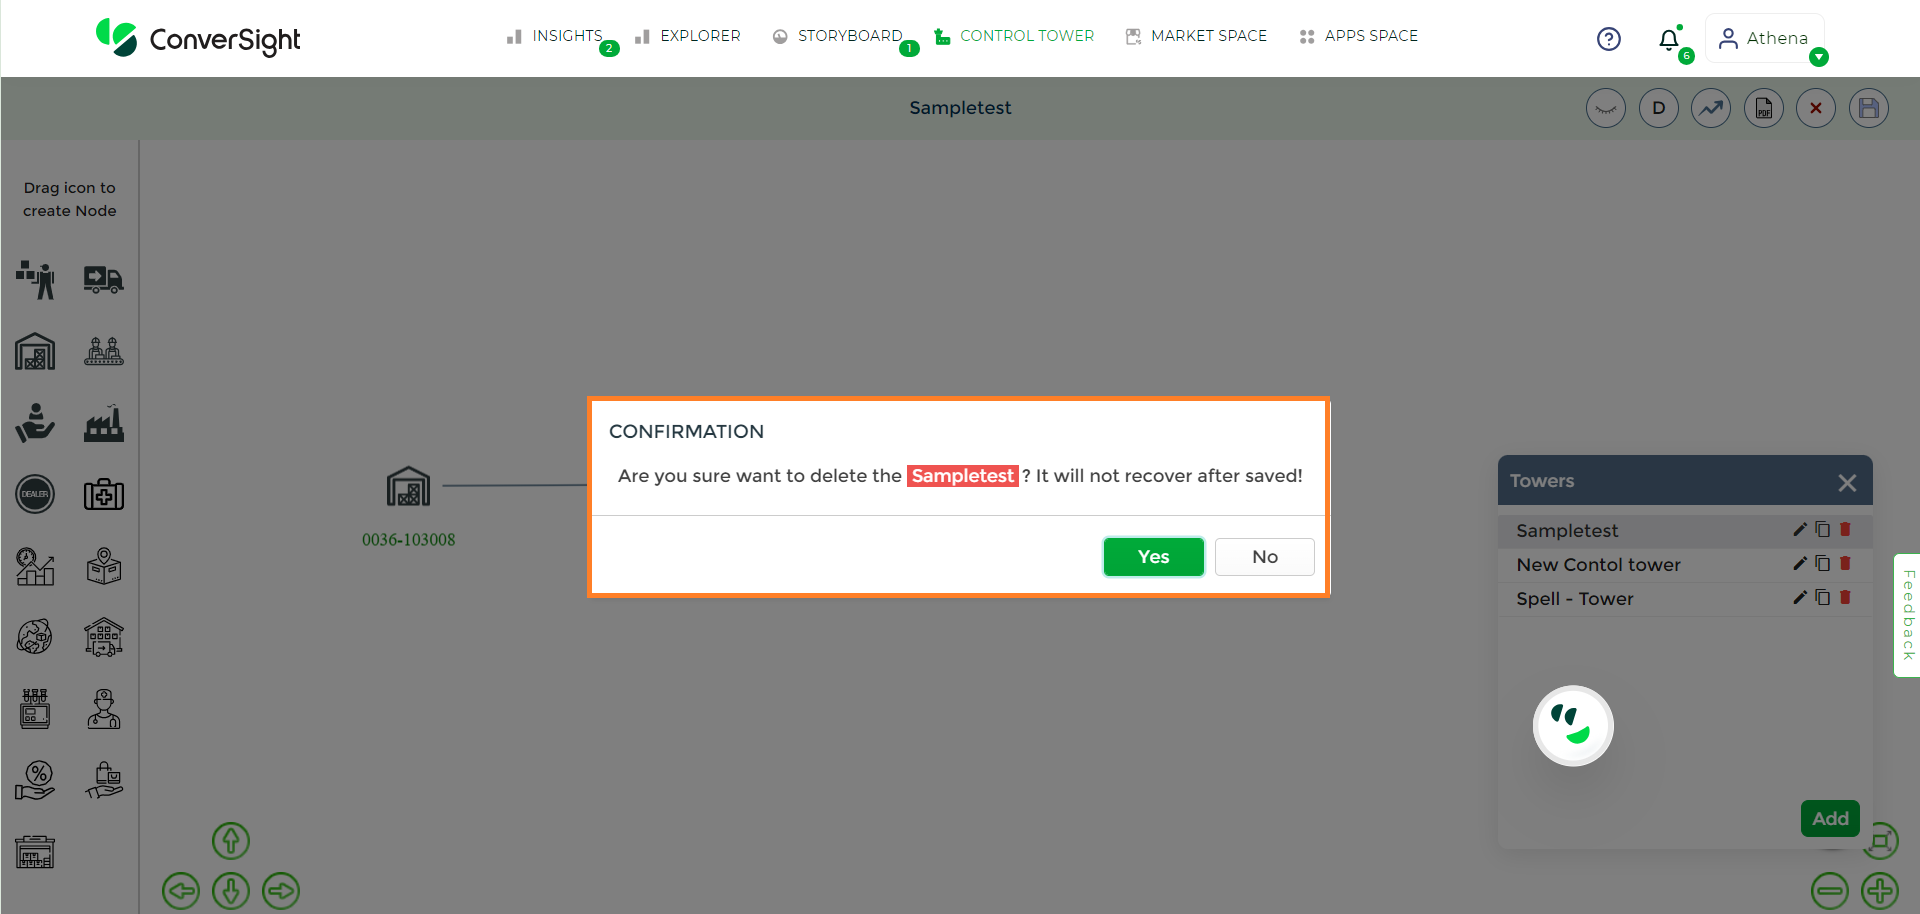
Delete Tower#
In summary, the Control Tower revolutionizes operations management by providing real-time insights and proactive response capabilities. It consolidates data for better decision-making and offers predictive insights. Its collaborative framework ensures supply chain objectives are met efficiently, while ongoing learning enriches its capabilities.