Formula on Table#
Formula on Table is done through the Calculated Value tab. The Calculated Value tab is used to create a custom column or cell that contains a formula or expression that performs a specific calculation based on the values in other cells or columns. The purpose of creating a Calculated Value is to automate the calculation process and to have a reference or future use and it would be saved as Calculated Columns . Calculated Columns can be generated in both the CS Table view and the Pivot Table view. Let’s delve into the specifics of each within their respective sections
Calculated Column in CS Table#
Here's a step-by-step guide on how to create a Calculated Column in the CS Table
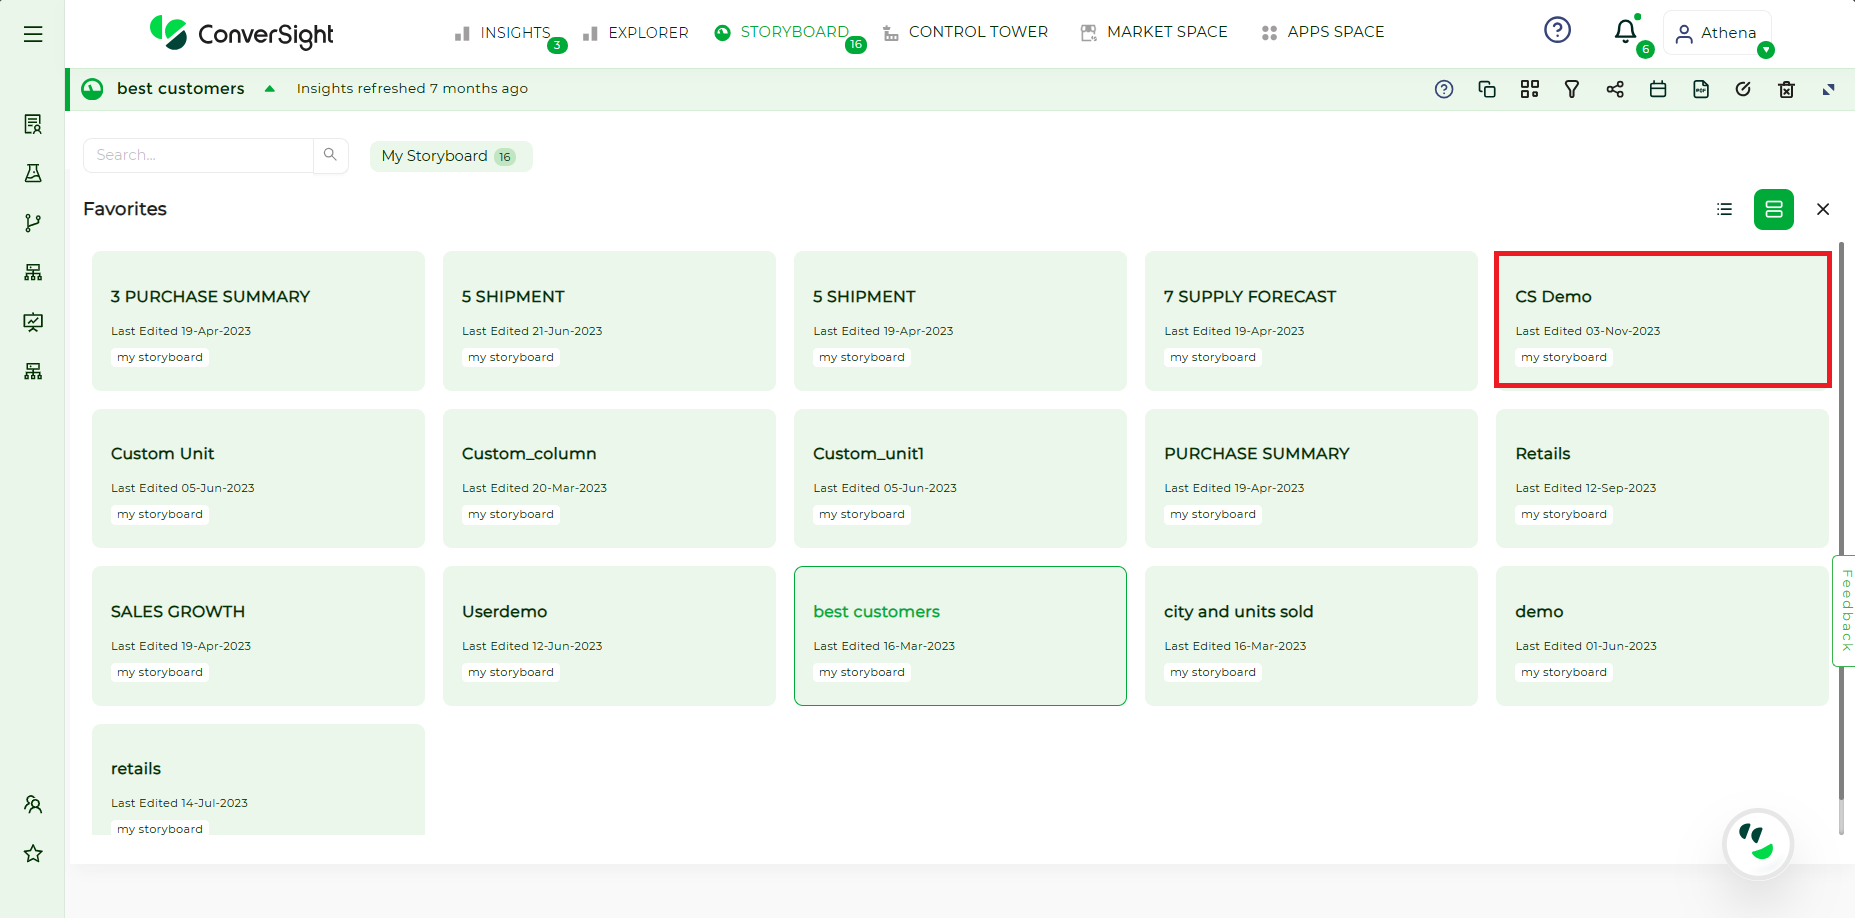
Step 1: Select the Explore icon within the insight where you wish to generate Calculated Column. This insight can be sourced from the Insights page, a storyboard or from a conversation in Athena.
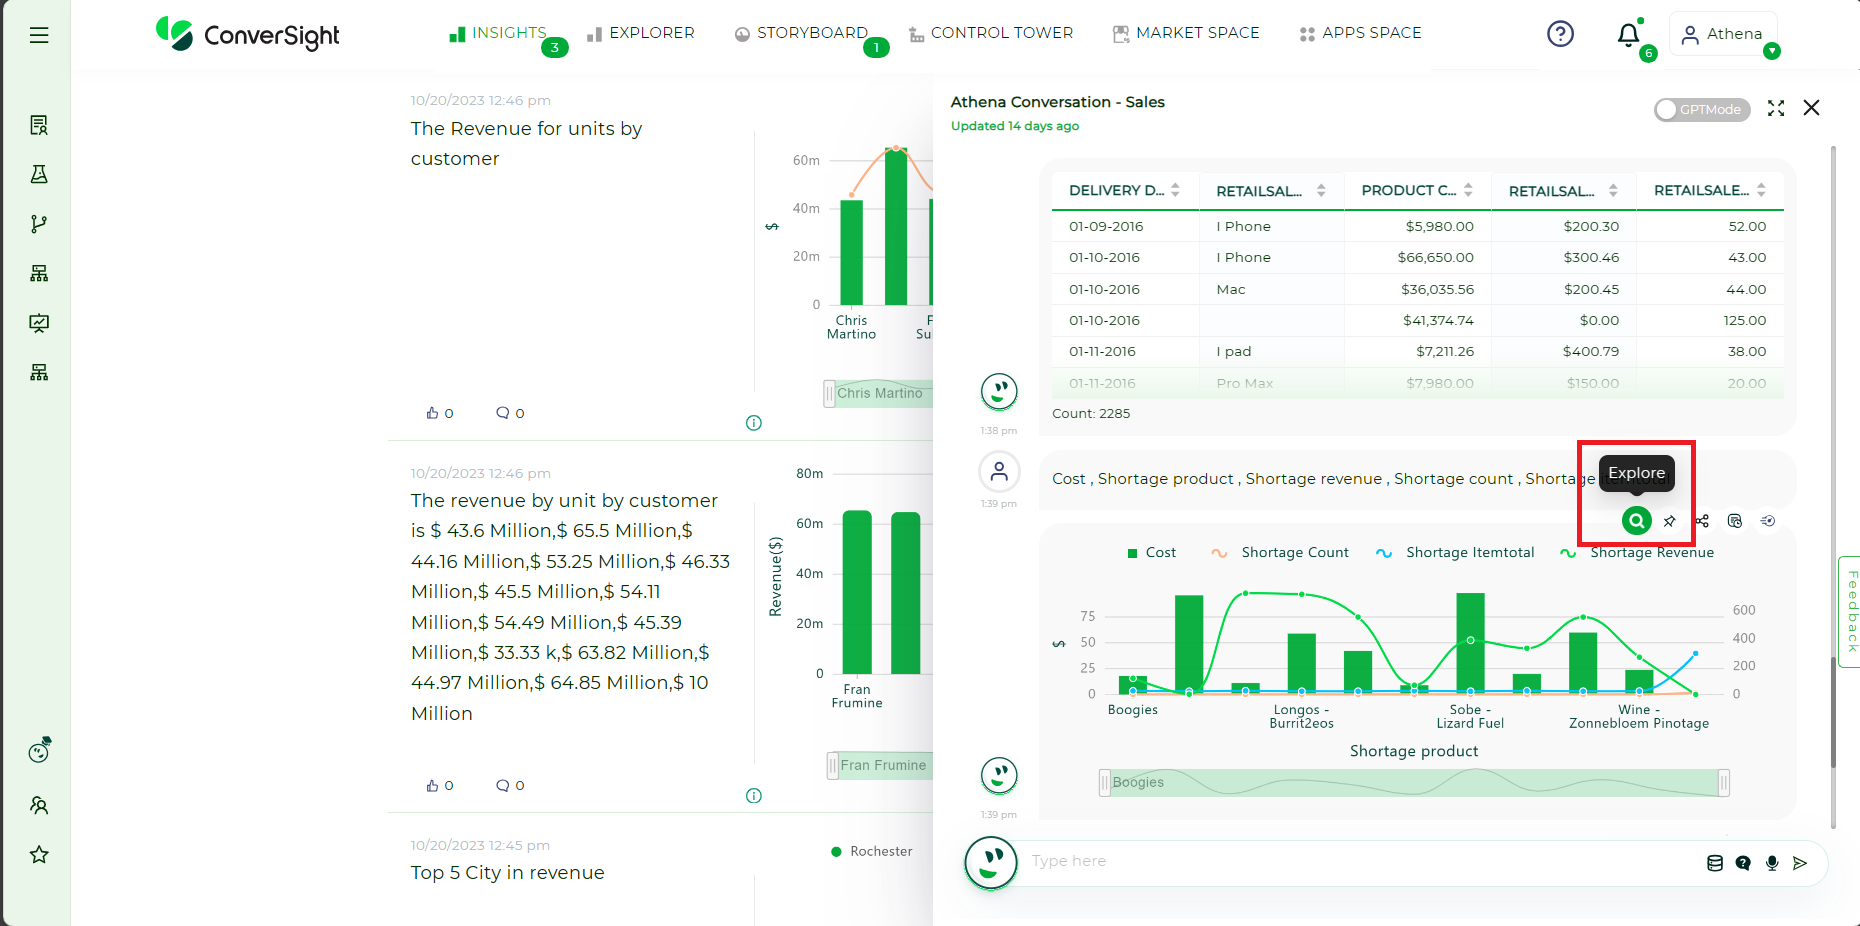
Explore Icon#
Step 2: The option to create Calculated Column is automatically accessible in the CS Table view. However, if you are working with other types of charts, simply click on the CS Table view and you’ll gain access to the Calculated Column feature.
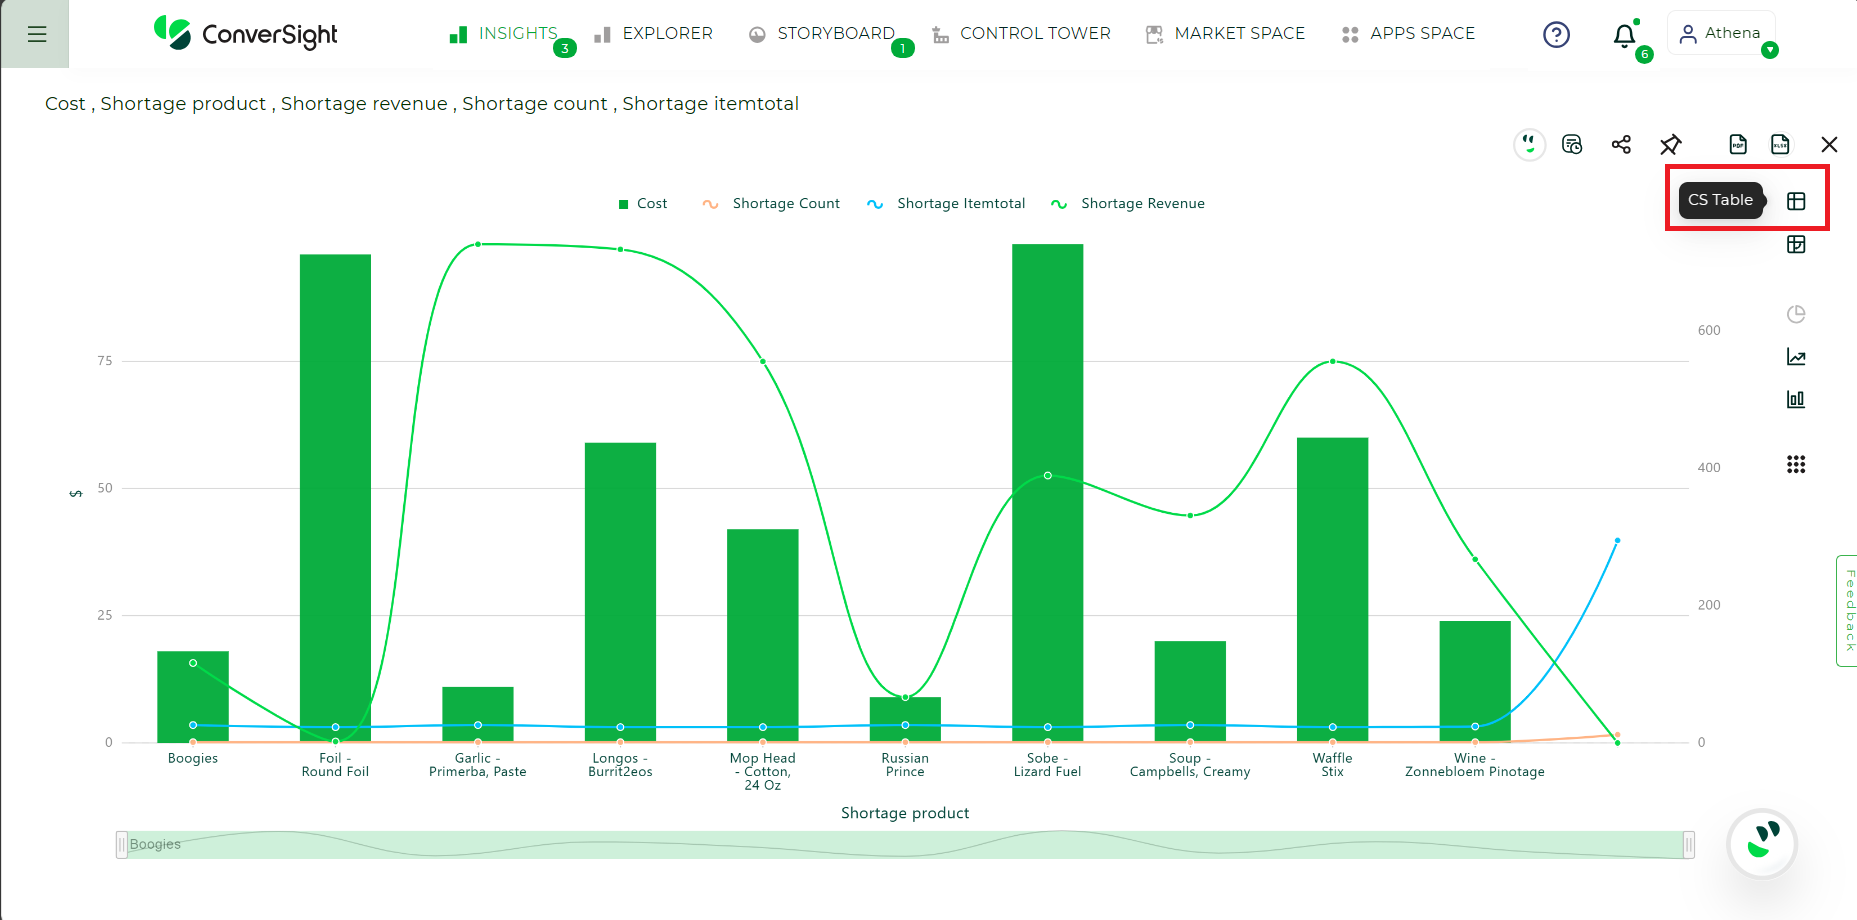
CS Table View#
Step 3: After selecting the CS Table view, any chart will transform into the CS Table view. Once the chart has been converted to CS Table view, click on + icon to access the form for creating a Calculated Column.
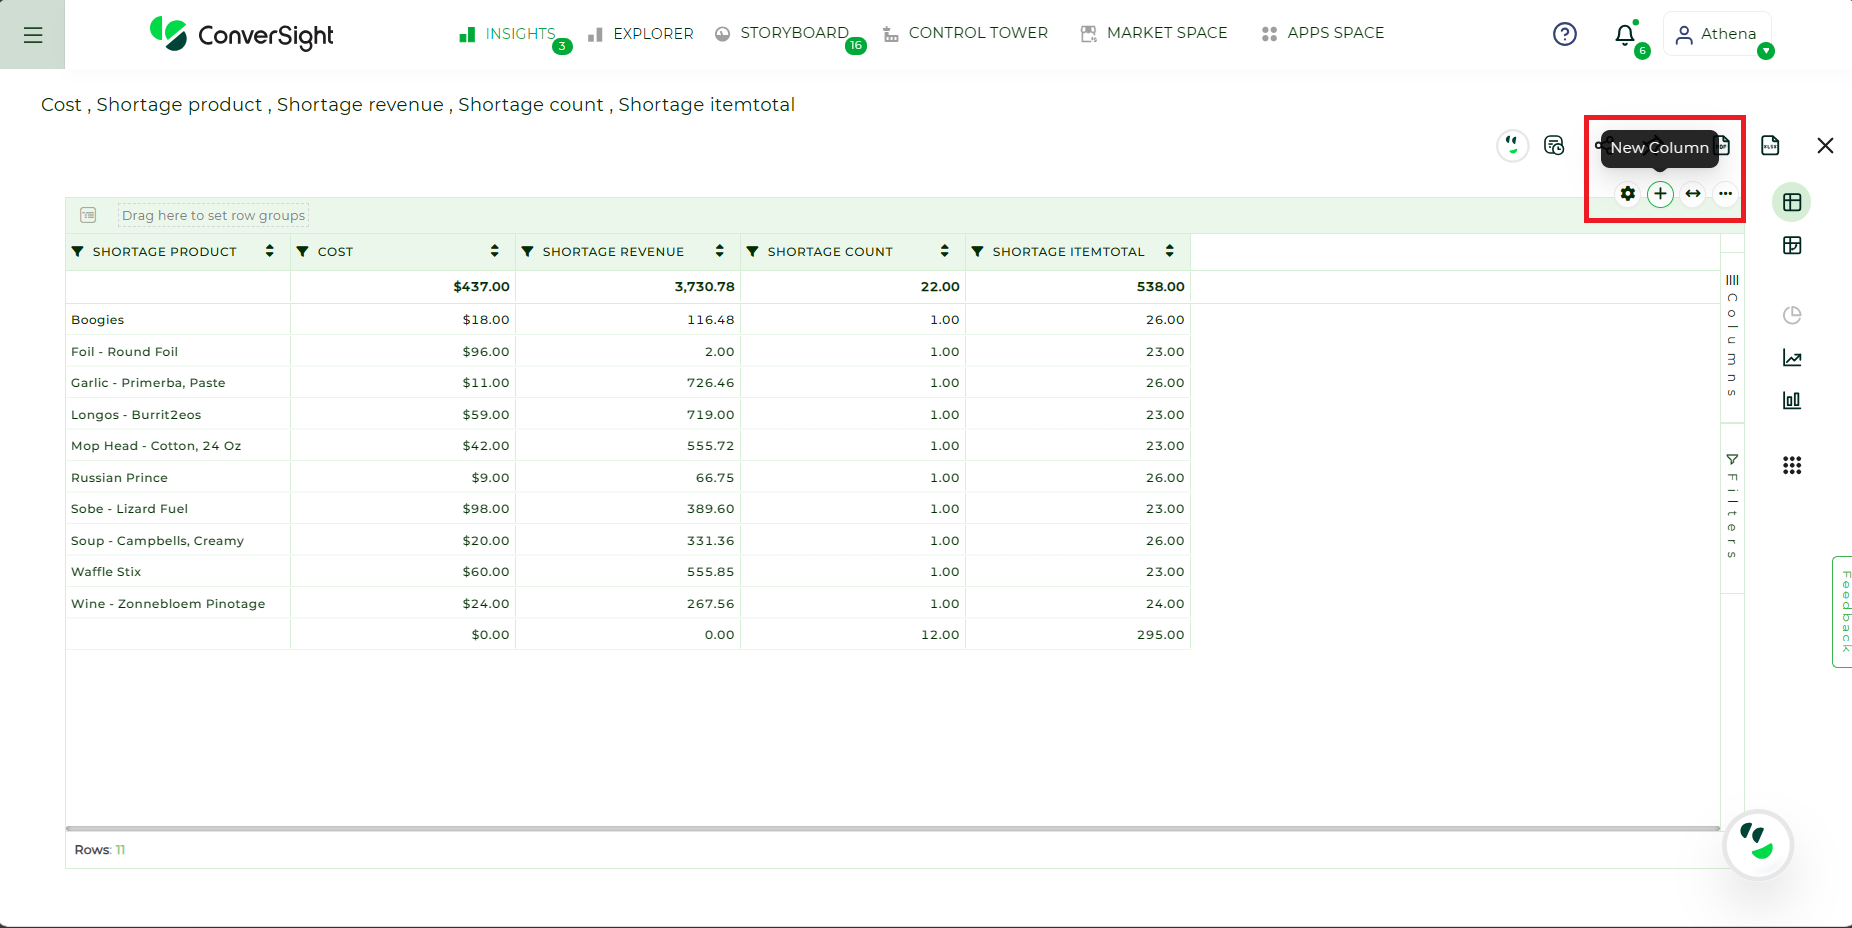
CS Table#
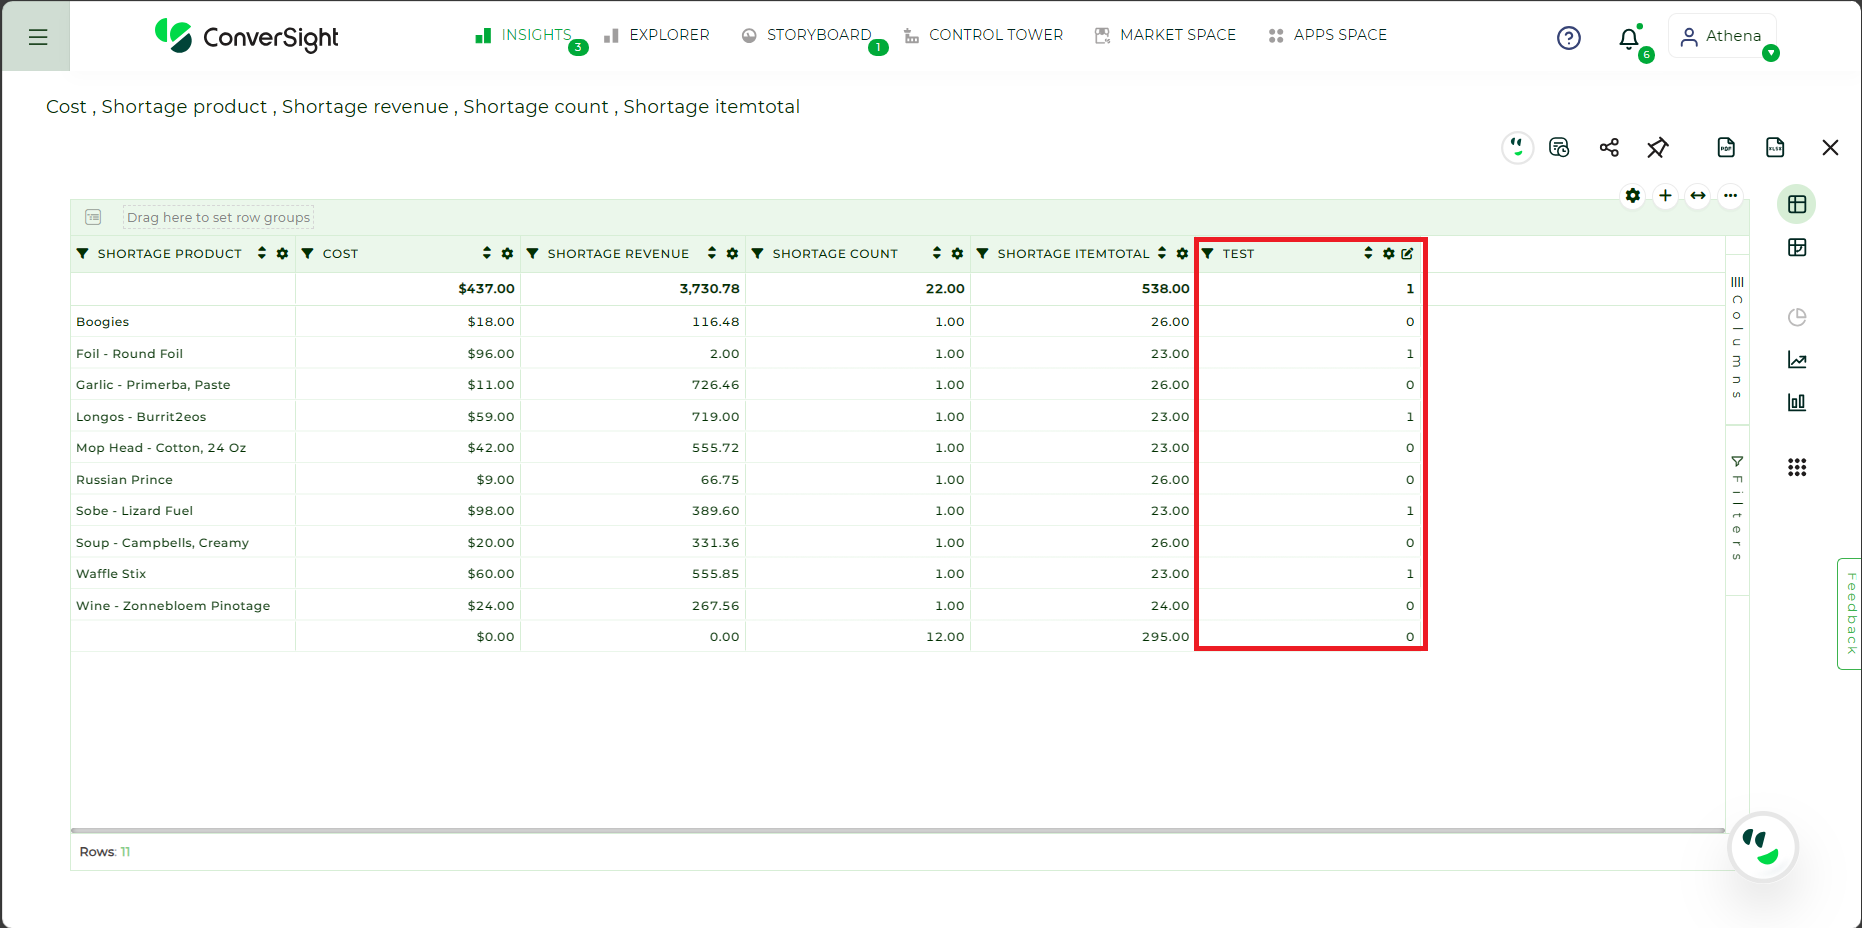
Step 4: Click + icon to add new column and it navigates to Calculated Value tab.
New Column#
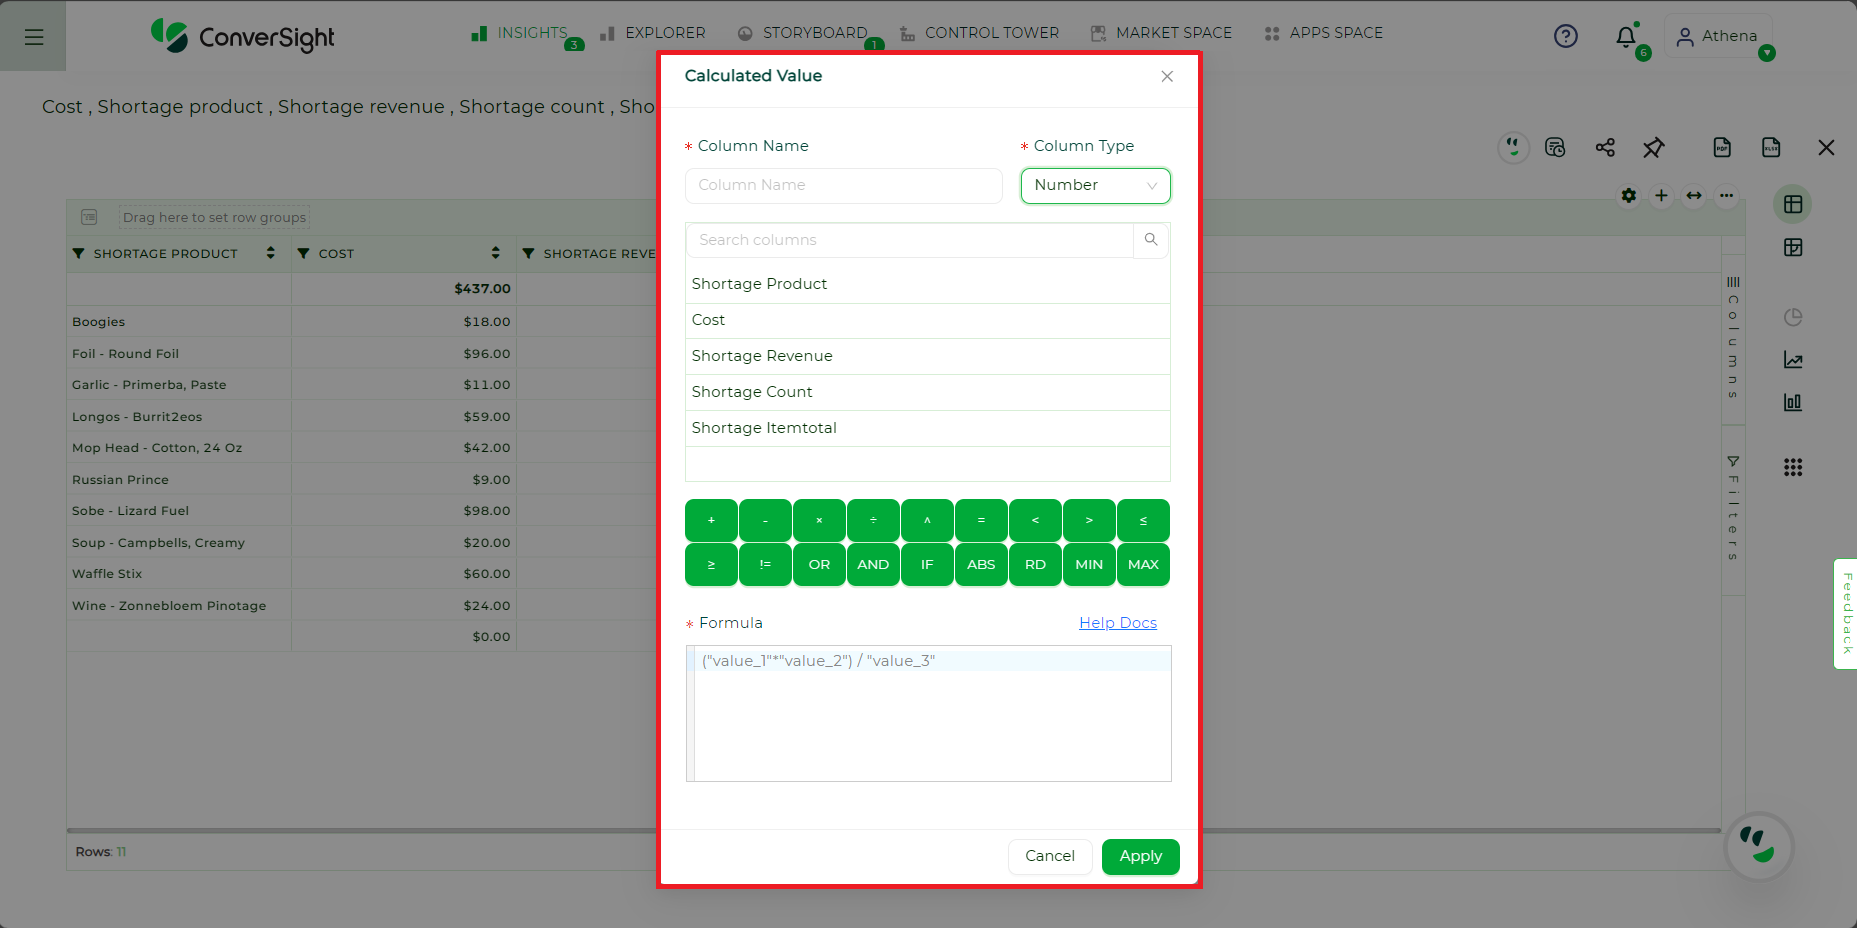
Step 5: On the Calculated Value tab, you can provide a name for your Calculated Column and select the Column Type, which determines the result type of the formula or condition applied. You have the choice of three Column Types: String, Number and Spark Line. You can then choose from a list of operations to use in creating your formula and enter the formula or condition in the provided box.
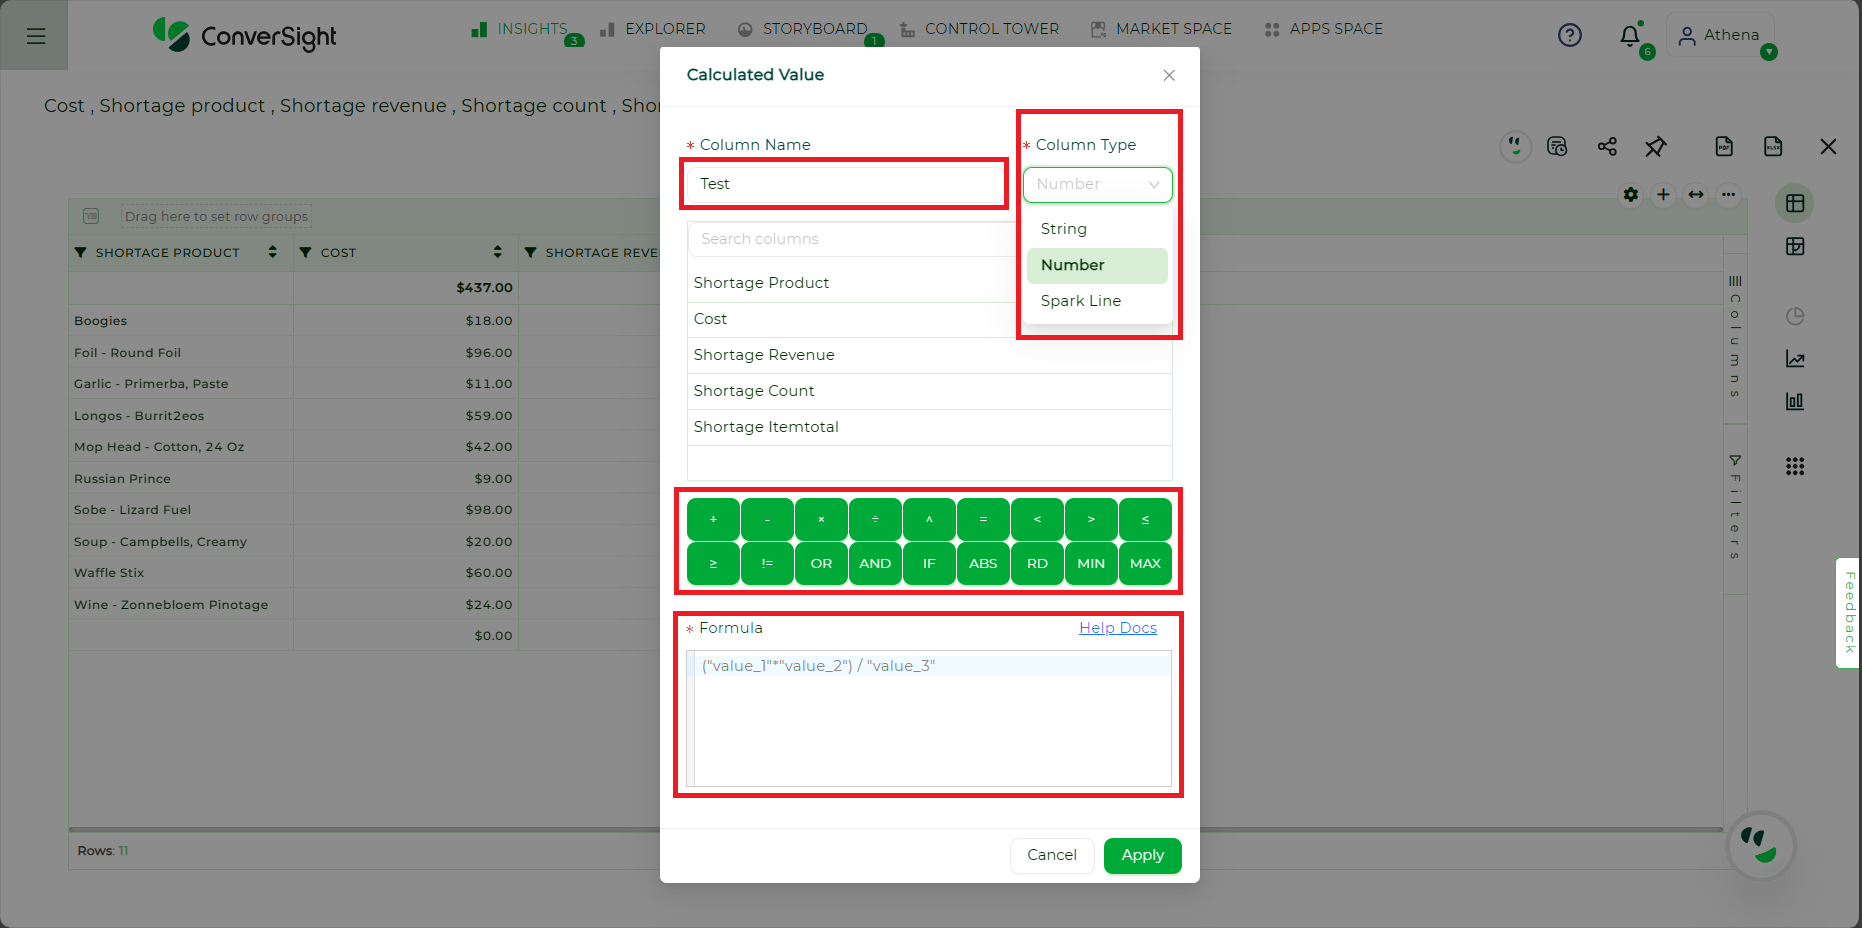
Calculated Value Page#
Step 6: Name your column and specify its type, then use the search bar to locate the columns in the table. You can simply drag and drop the column names into the formula box to create your formula with available operators.
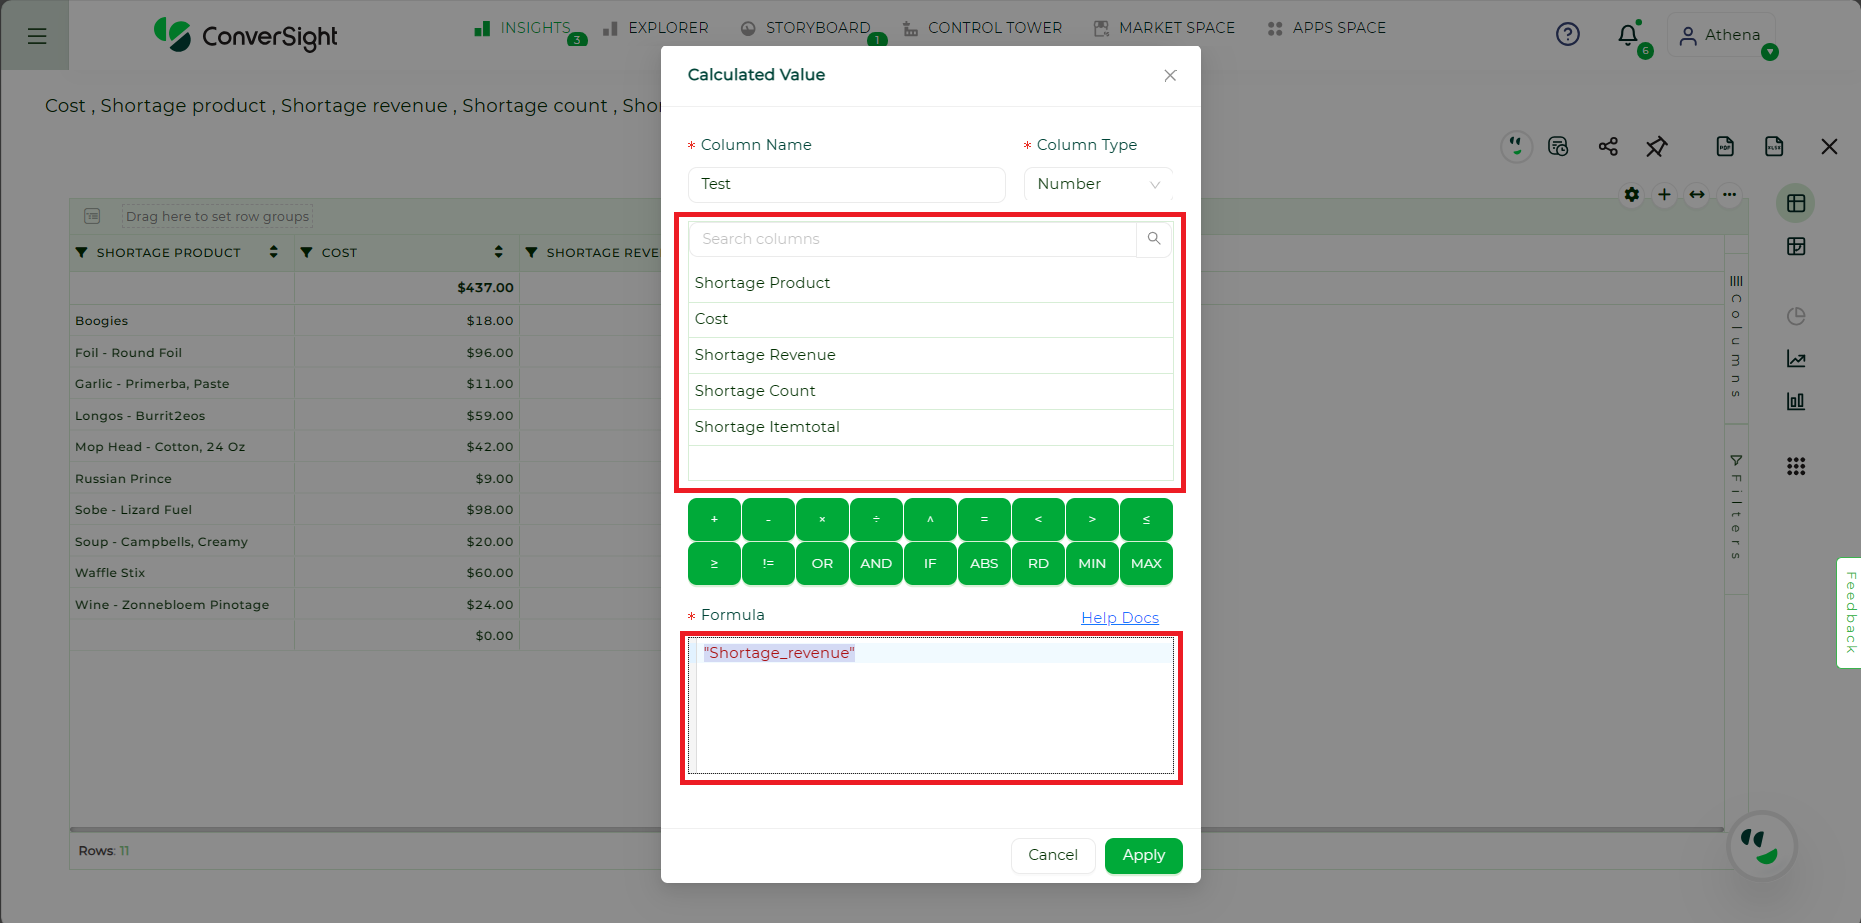
Calculated Value Page#
For Number Column Type: If you select the column type as Number, you need to create formulas that produce numeric results.
Example 1: You can utilize basic arithmetic functions in the formula box.
("Shortage_revenue"*"Shortage_cost_") / "Shortage_count"
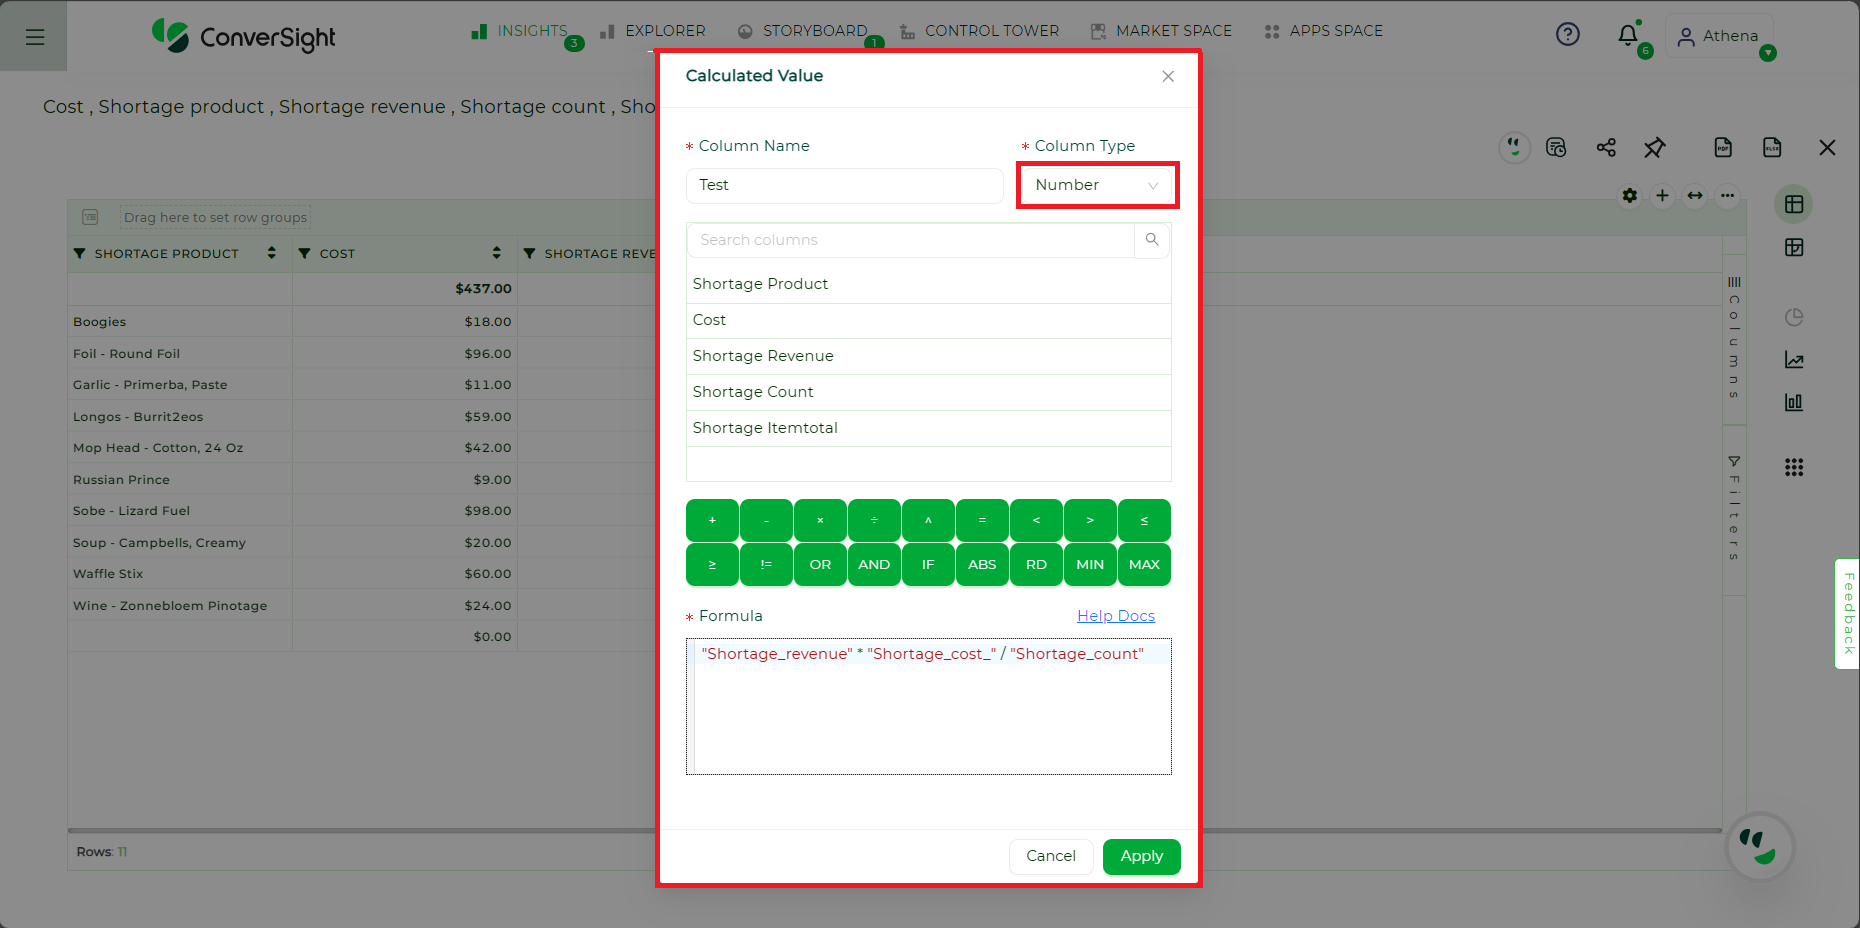
Number Column Type#
Click on Apply to view the result.
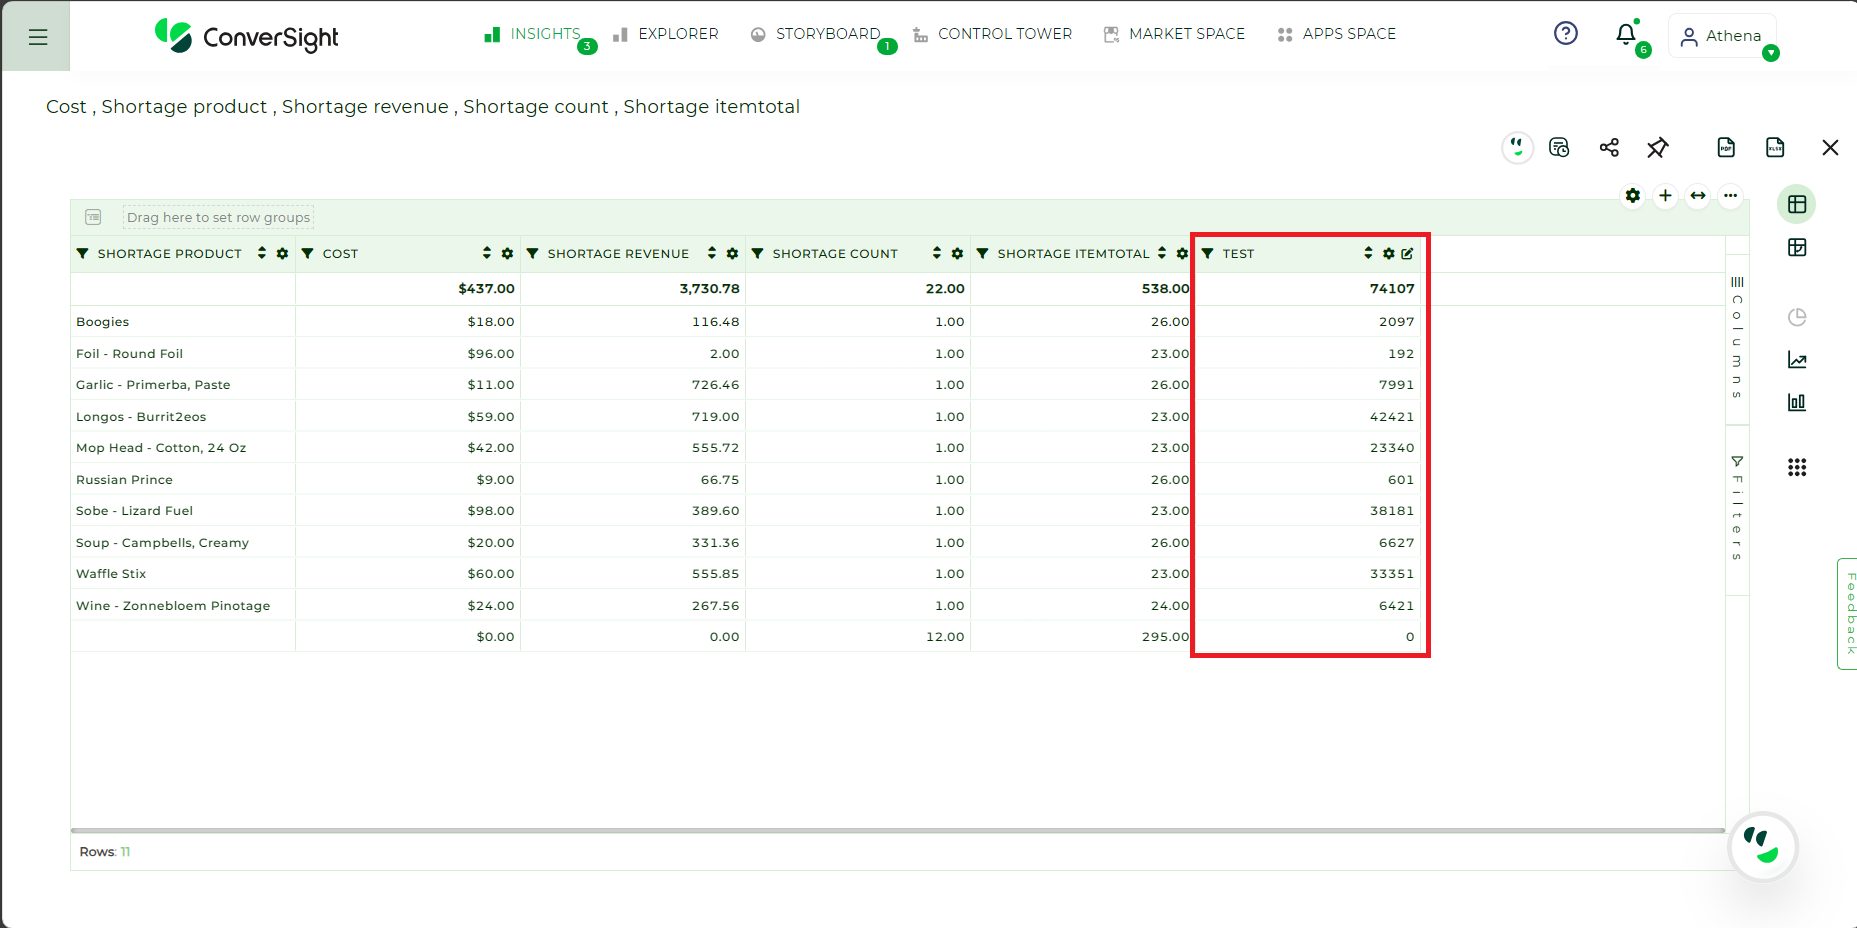
Column Added#
Example 2: You can utilize conditional formatting to generate a numeric outcome.
if ("Shortage_cost_" < 50 ) {
'1'
}  else if ("Shortage_cost_" > 50) {
'0'
}

Number Column Type#
Click on Apply to view the result.
Column Added#
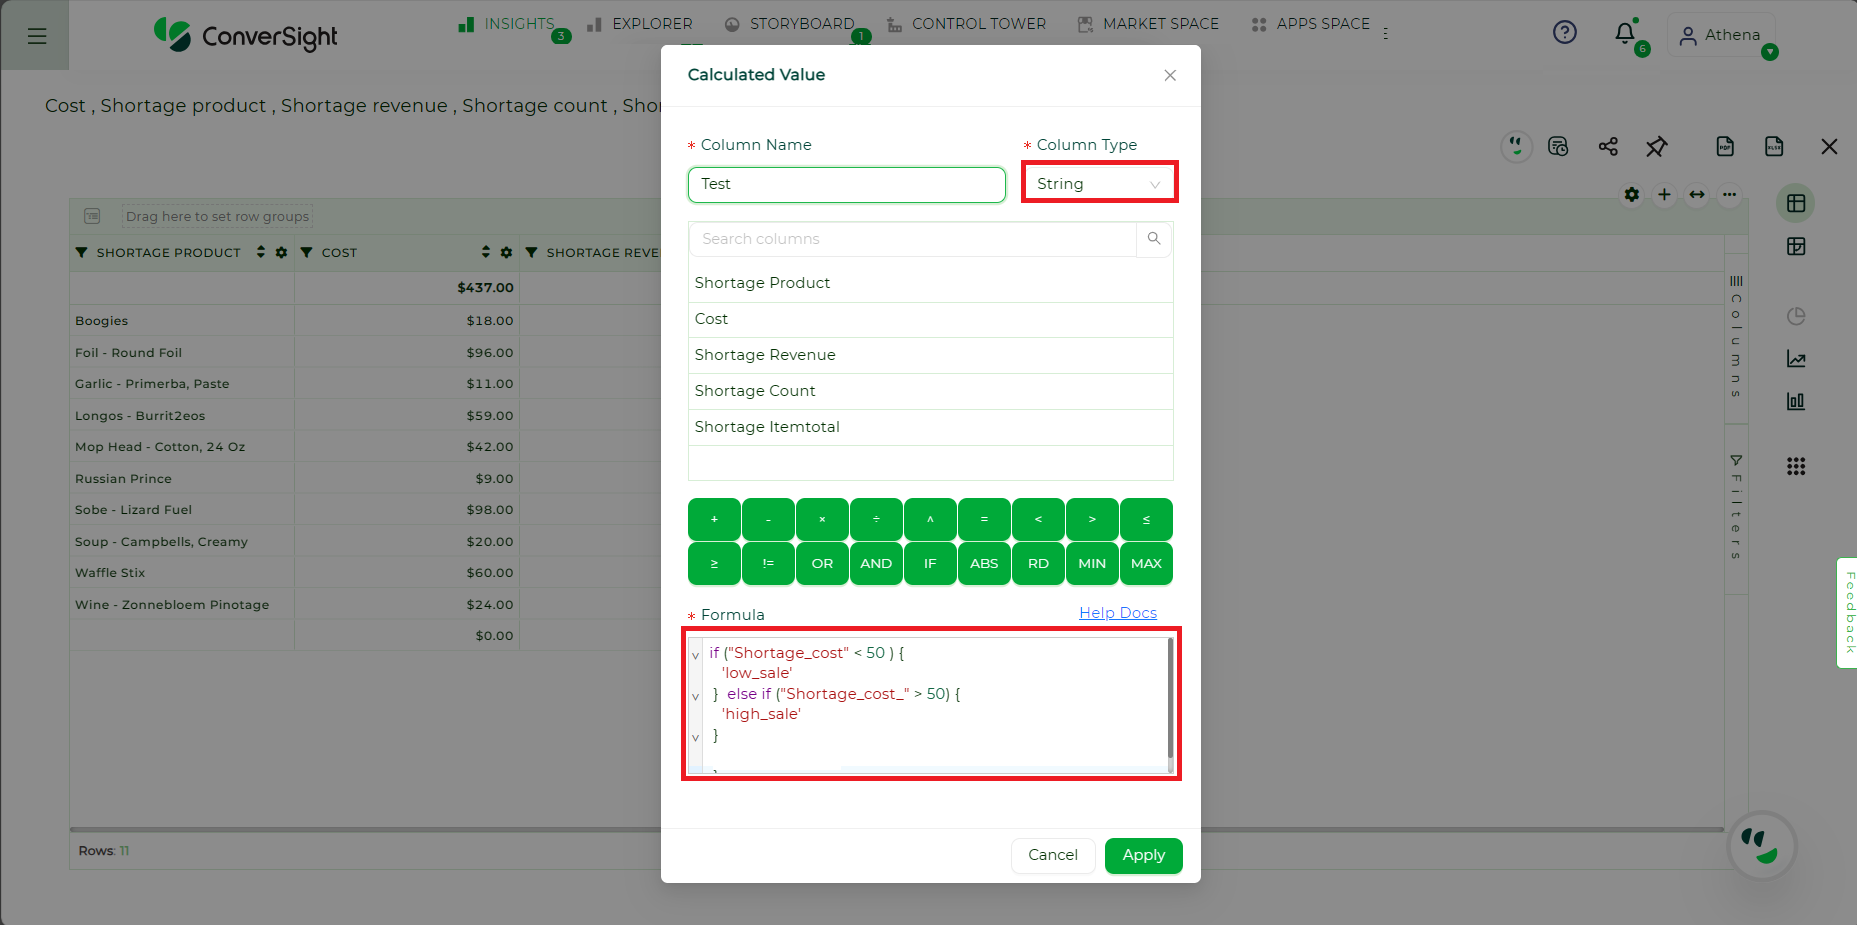
For String Column Type: If you select the column type as String, you need to create formulas that produce String as result.
Example: You can utilize conditional formatting to generate a numeric outcome.
if ("Shortage_cost_" < 50 ) {
'low_sale'
}  else if ("Shortage_cost_" > 50) {
'high_sale'
}
String Column Type#
Click on Apply to view the result.
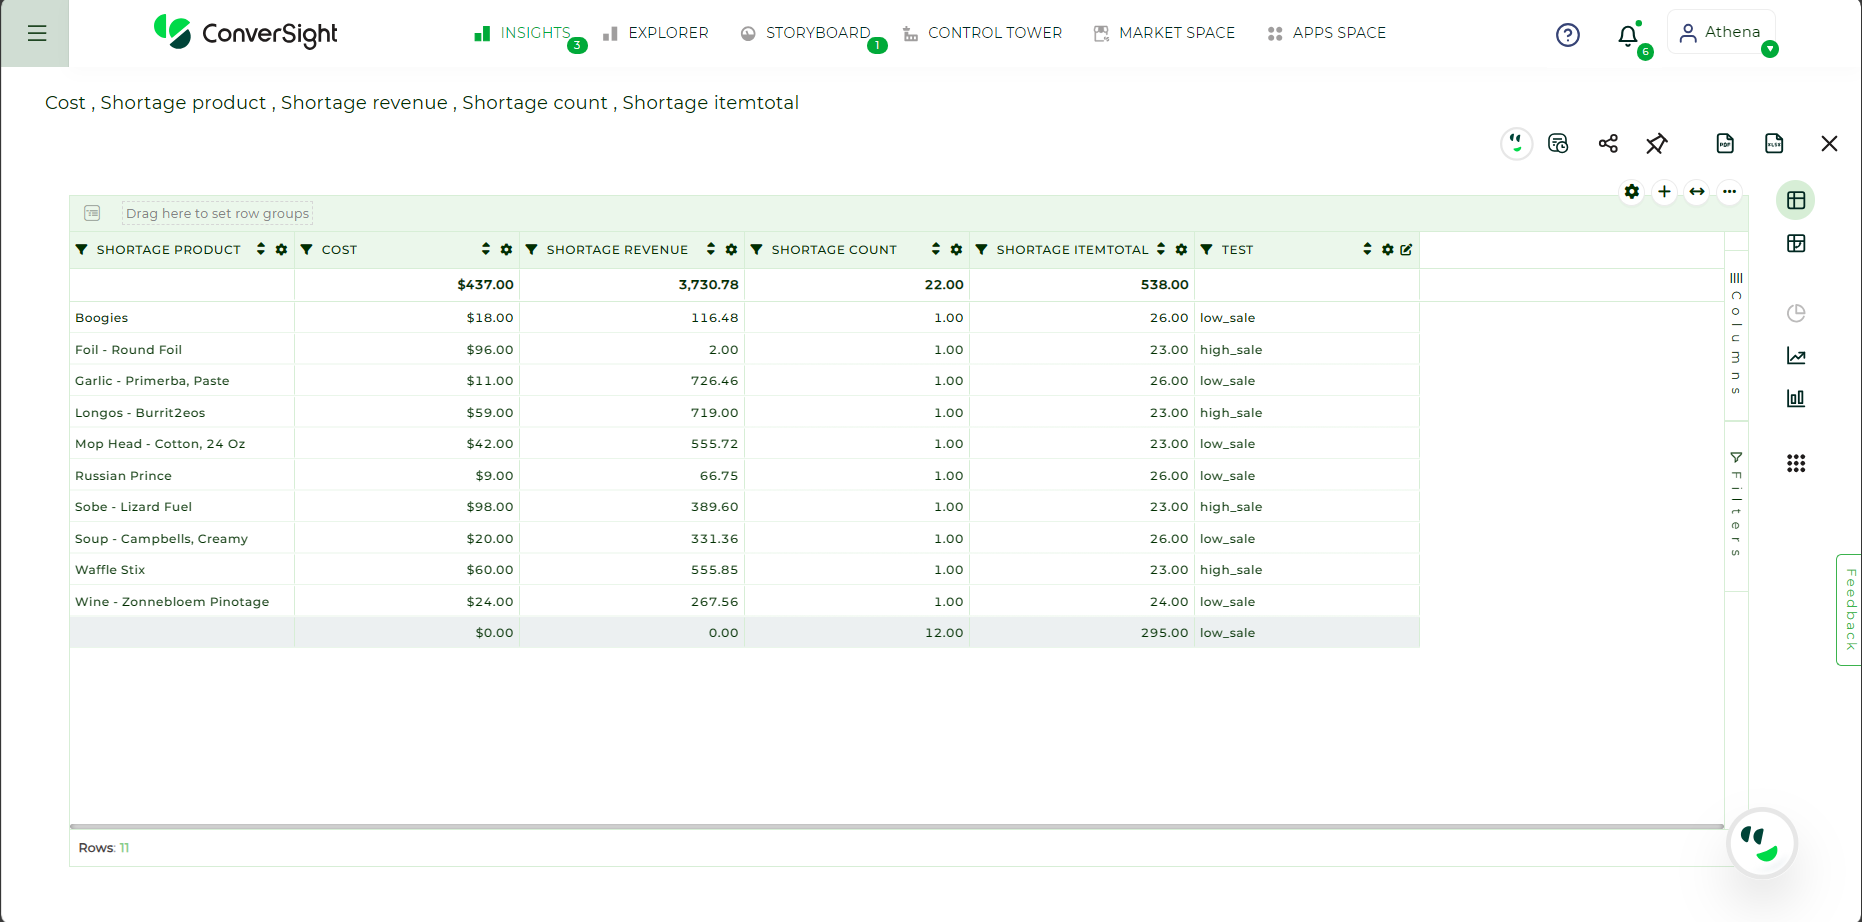
Column Added#
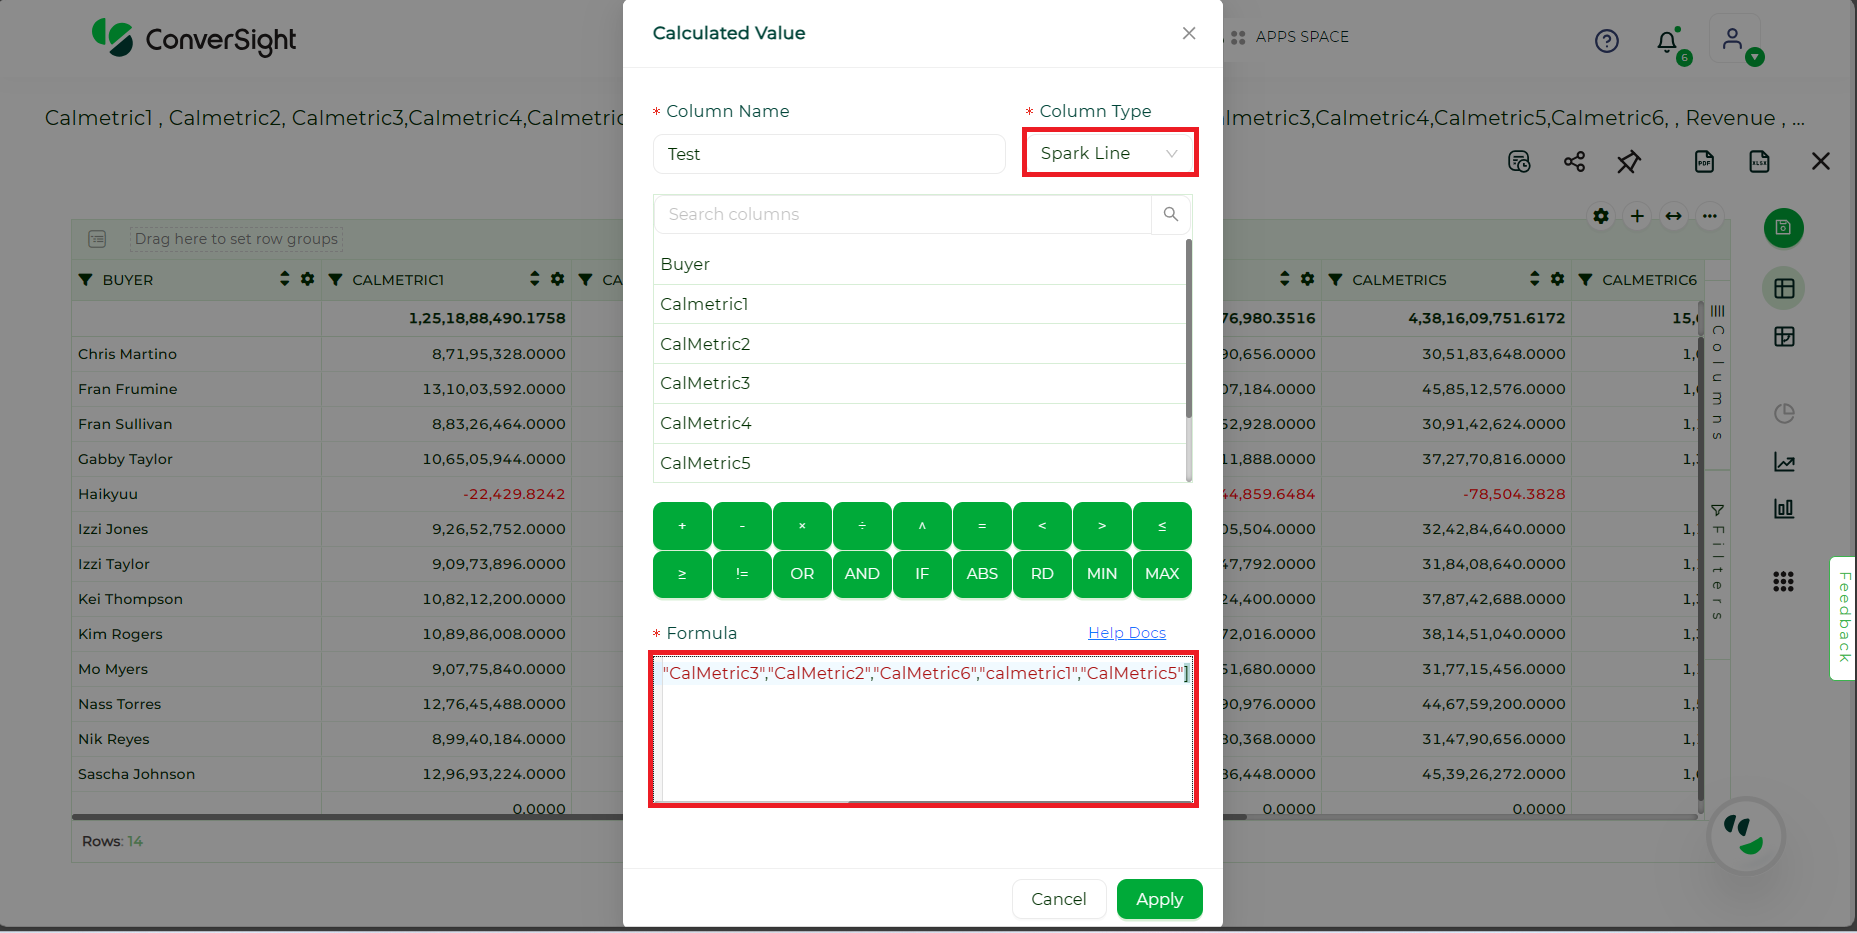
For Spark Line Column Type: The Spark Line column type is chosen when you wish to visualize a chart directly within the cells for comparing multiple columns simultaneously. Spark lines only accept an array of columns as input.
Example: Provide multiple columns in an array format as input.
["RetailSales_revenue","CalMetric4","CalMetric3","CalMetric2","CalMetric6","calmetric1","CalMetric5"]
Spark Line Column Type#
Click on Apply to view the result.
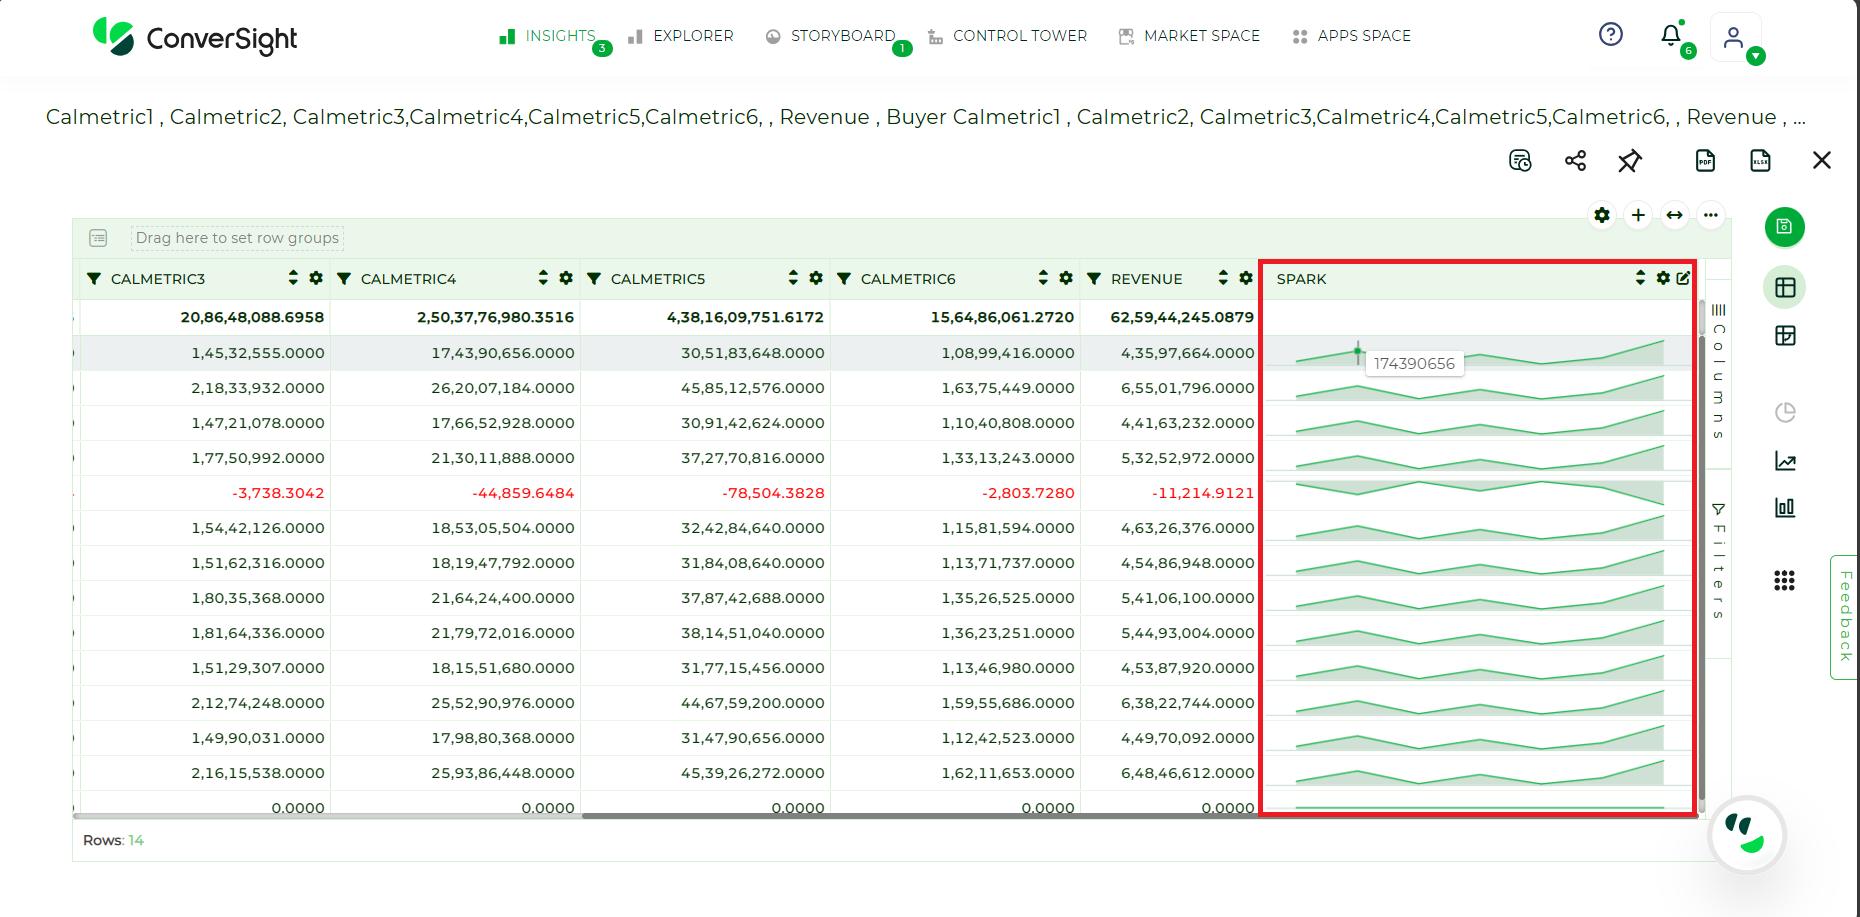
Column Added#
Step 7: To create a new table with the Calculated Column, user can pin the table to the Storyboard by clicking Pin icon on the options and it pop-ups an Add to Storyboard form.
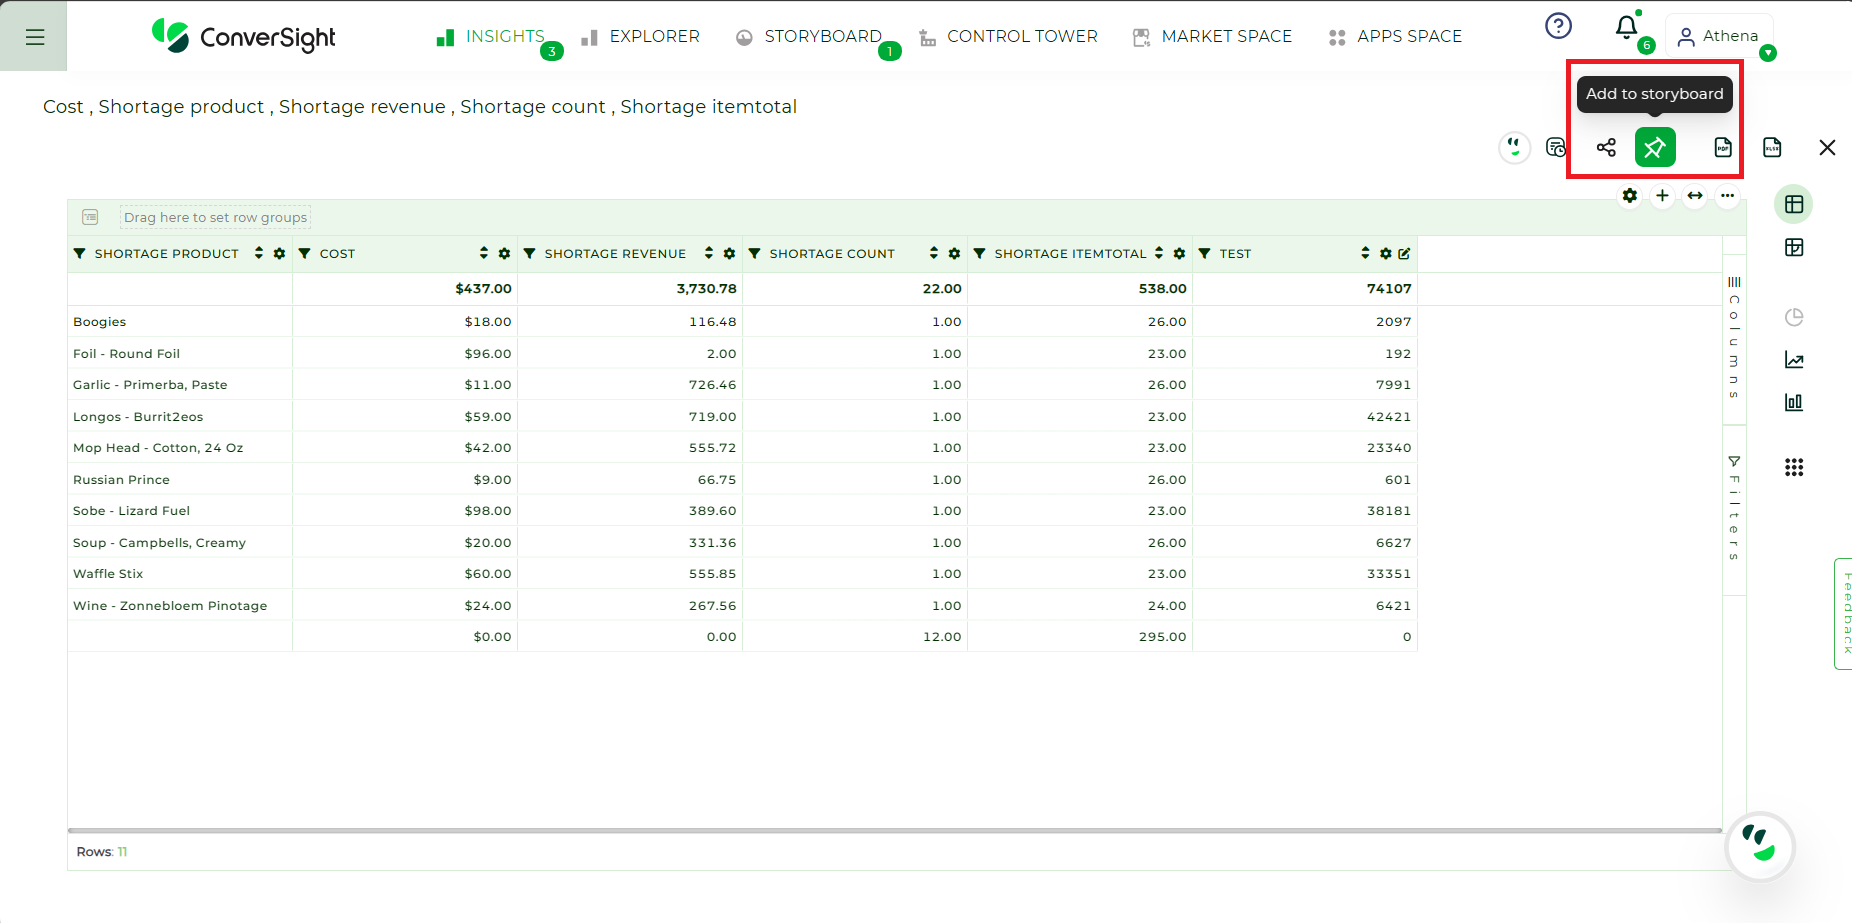
Add to Storyboard#
Step 8: Click +Create to create new one else you can select one of the already existing table in the Storyboard and click Add to add it to the Storyboard.
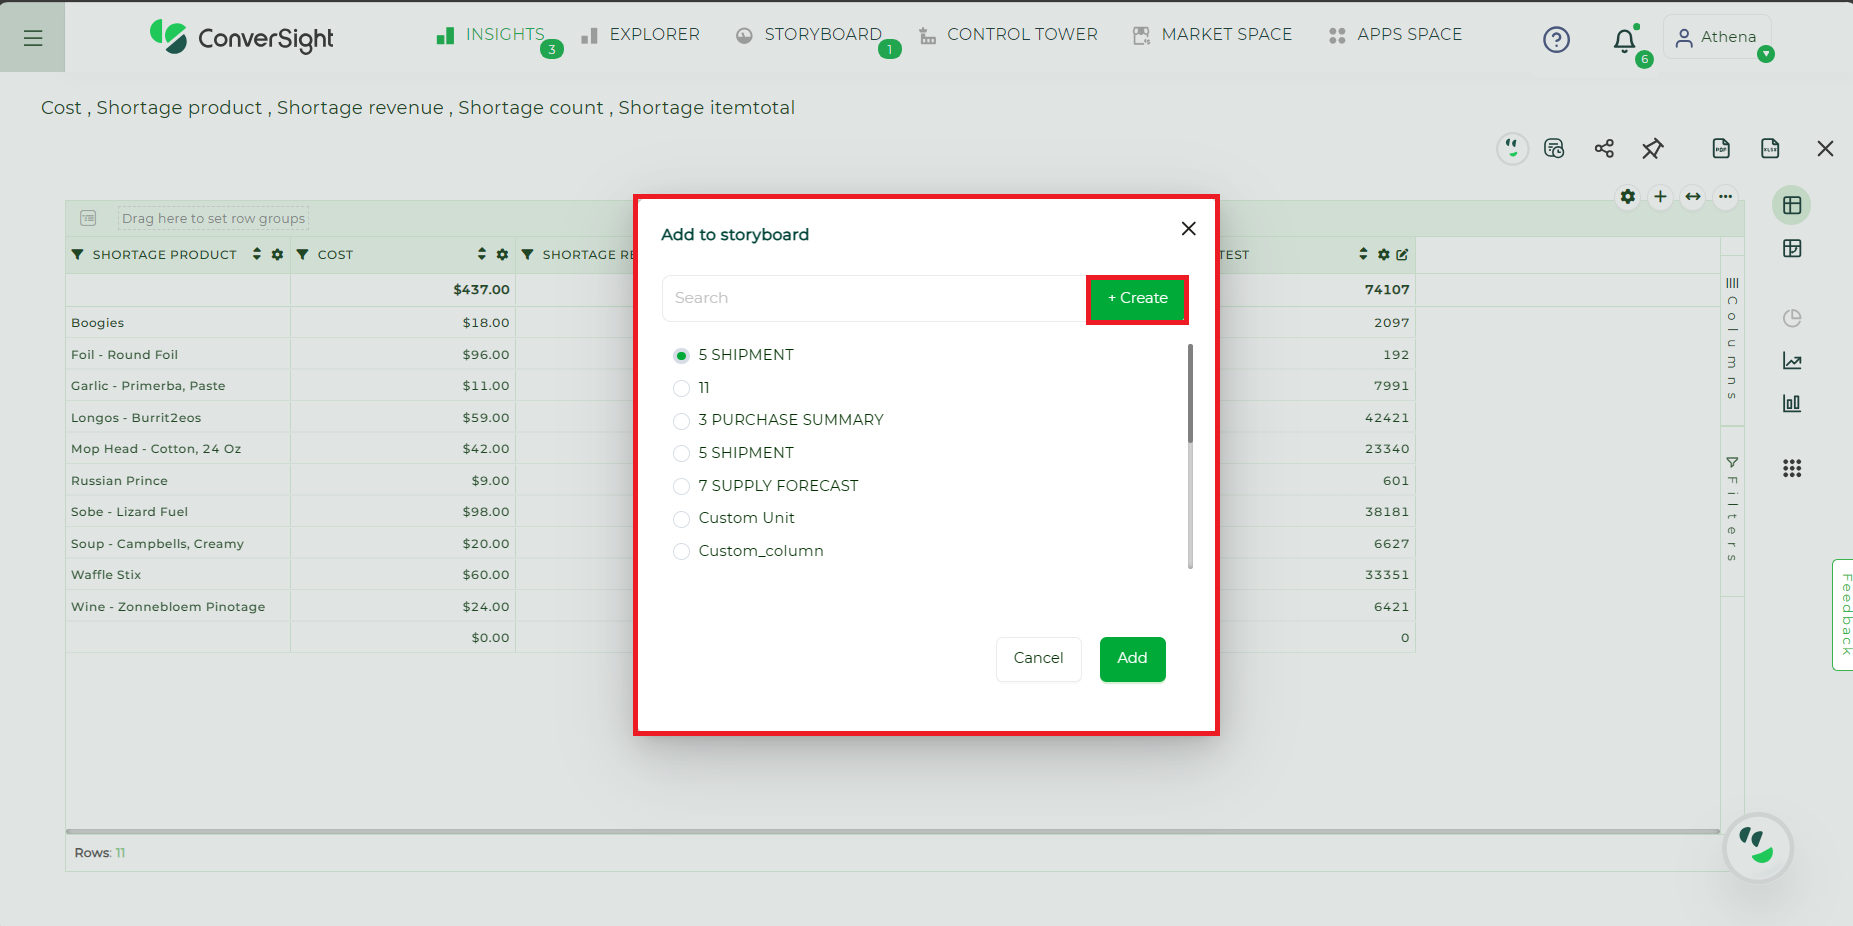
Create New#
Step 9: As we are creating new table click +Create and it pop-ups an Create Storyboard. Name the table and add it to Storyboard by clicking Create & Add for the future reference.
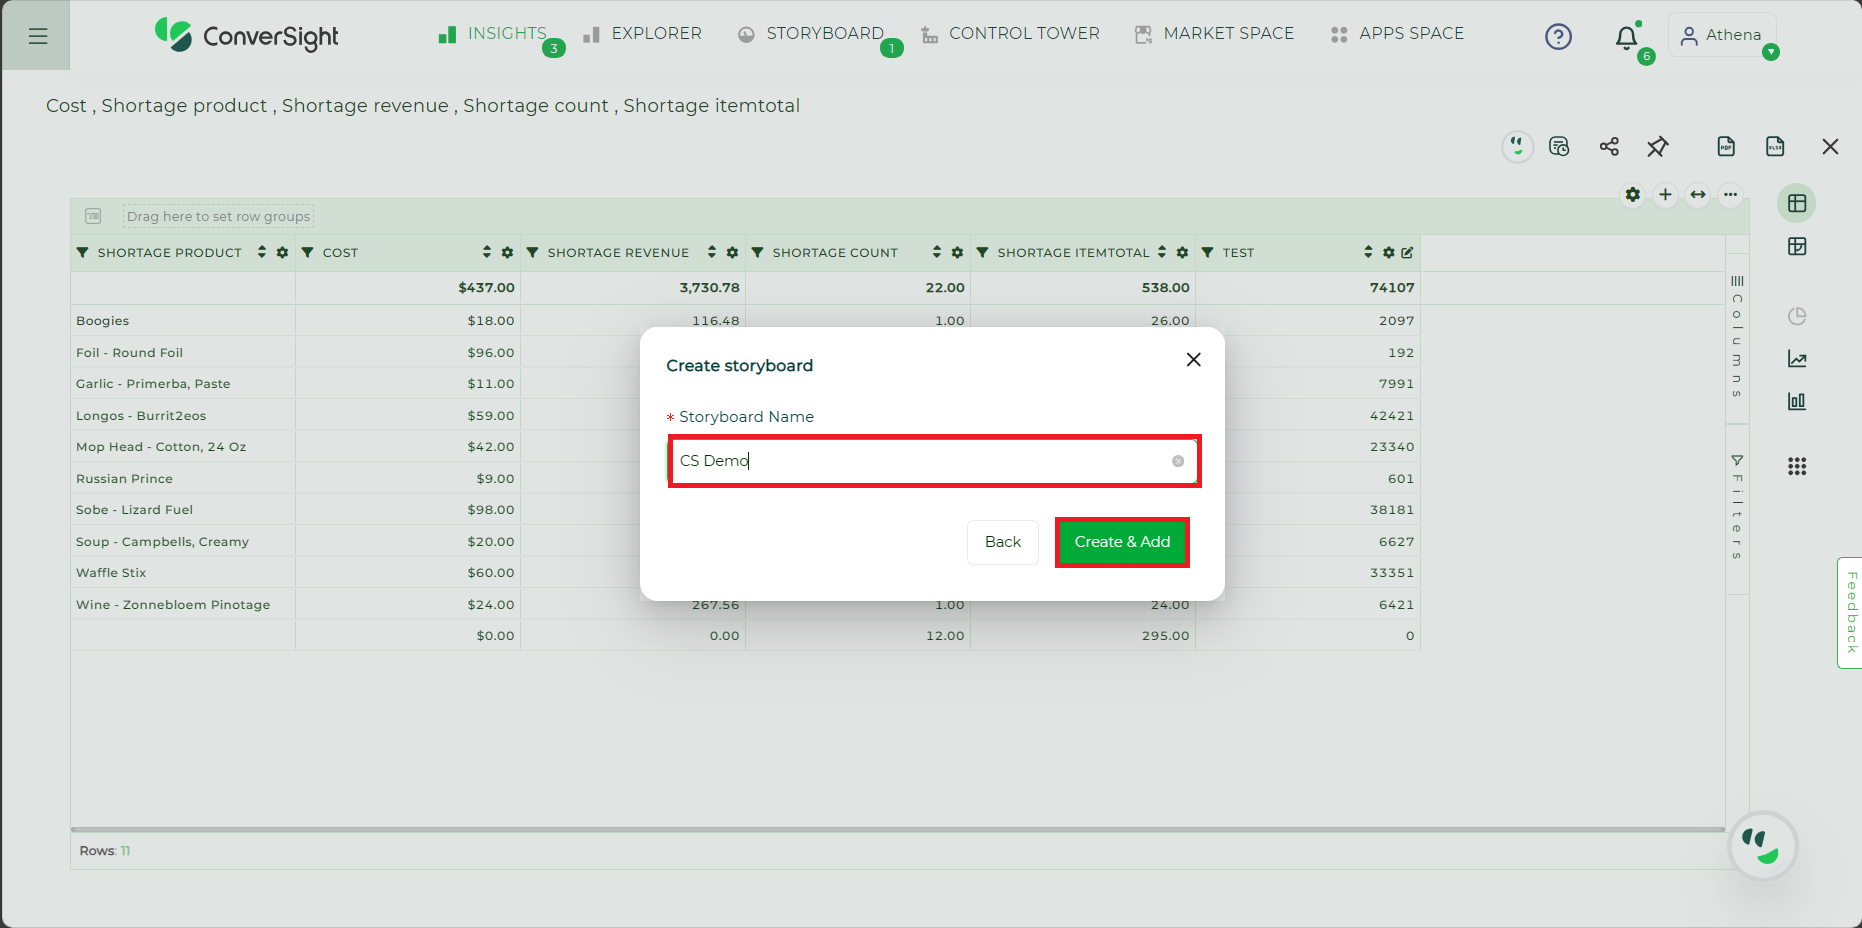
Create Storyboard#
Step 10: As you can see the table is displayed in the Storyboard
Added to Storyboard#
Calculated Column in Pivot Table#
Here's a step-by-step guide on how to create a Calculated Column in the Pivot Table
Step 1: Select the Explore icon within the insight where you wish to generate Calculated Column. This insight can be sourced from the Insights page, a storyboard or from a conversation in Athena.
Explore Icon#
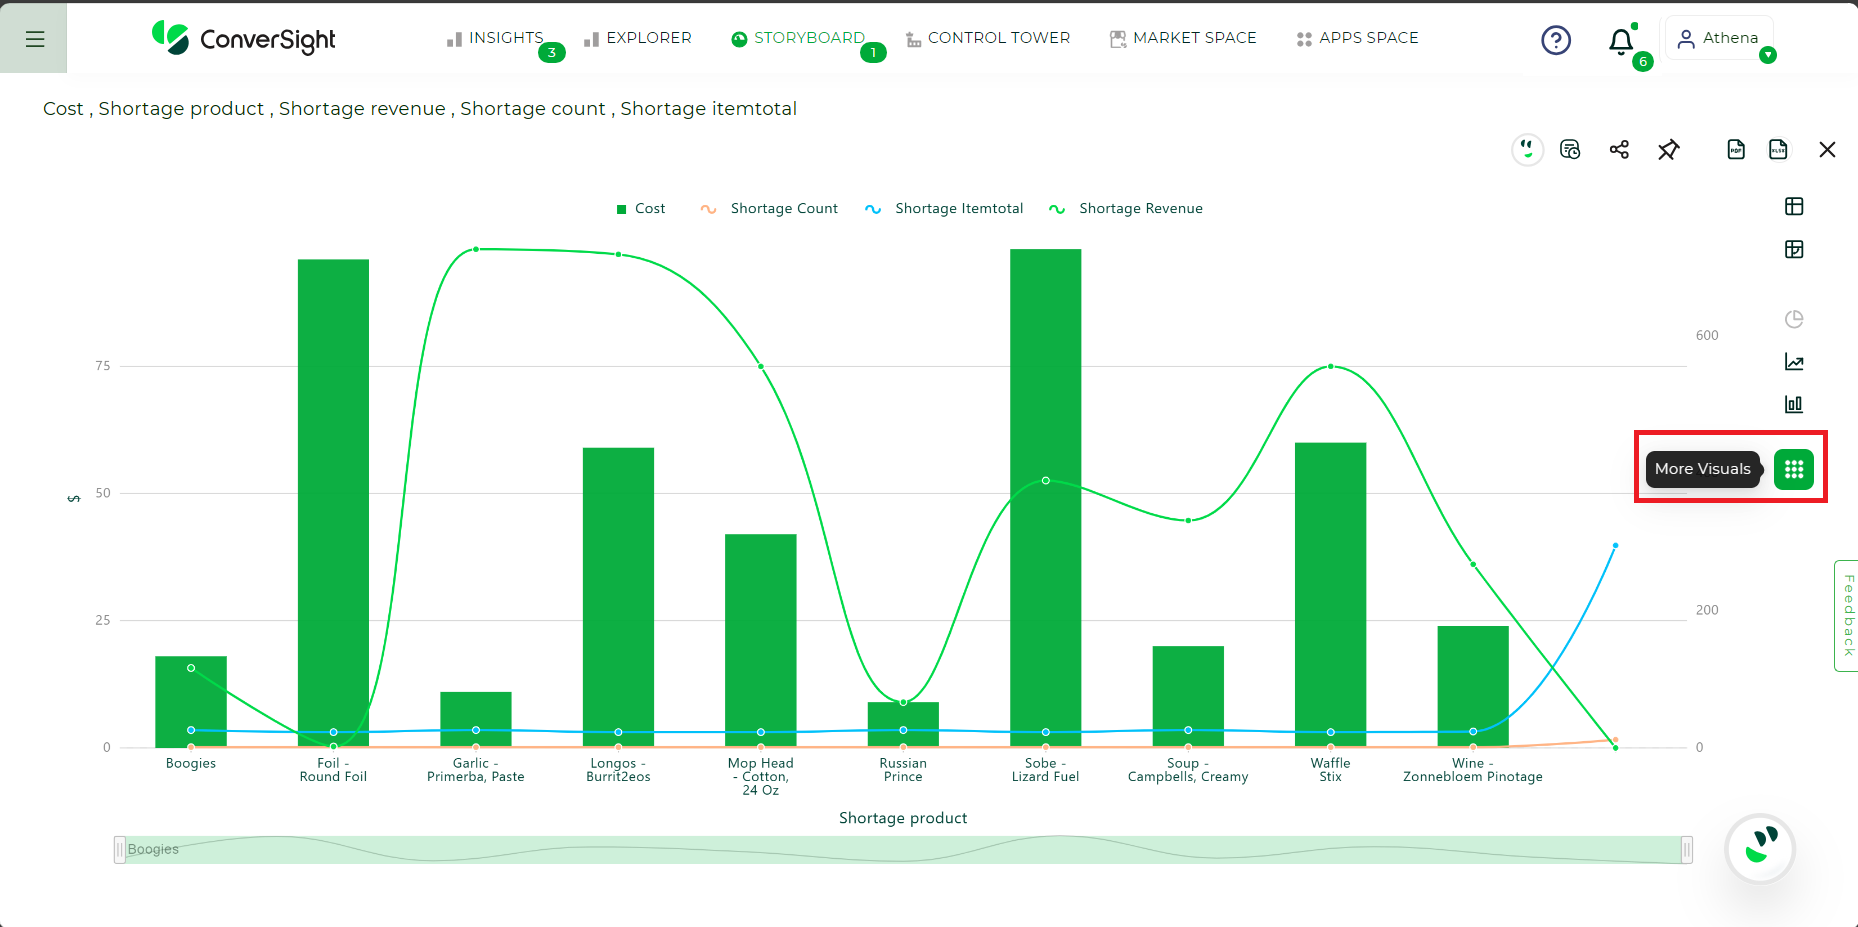
Step 2: To switch any chart or table to Pivot Table view, simply click on More Visuals.
More Visuals Option#
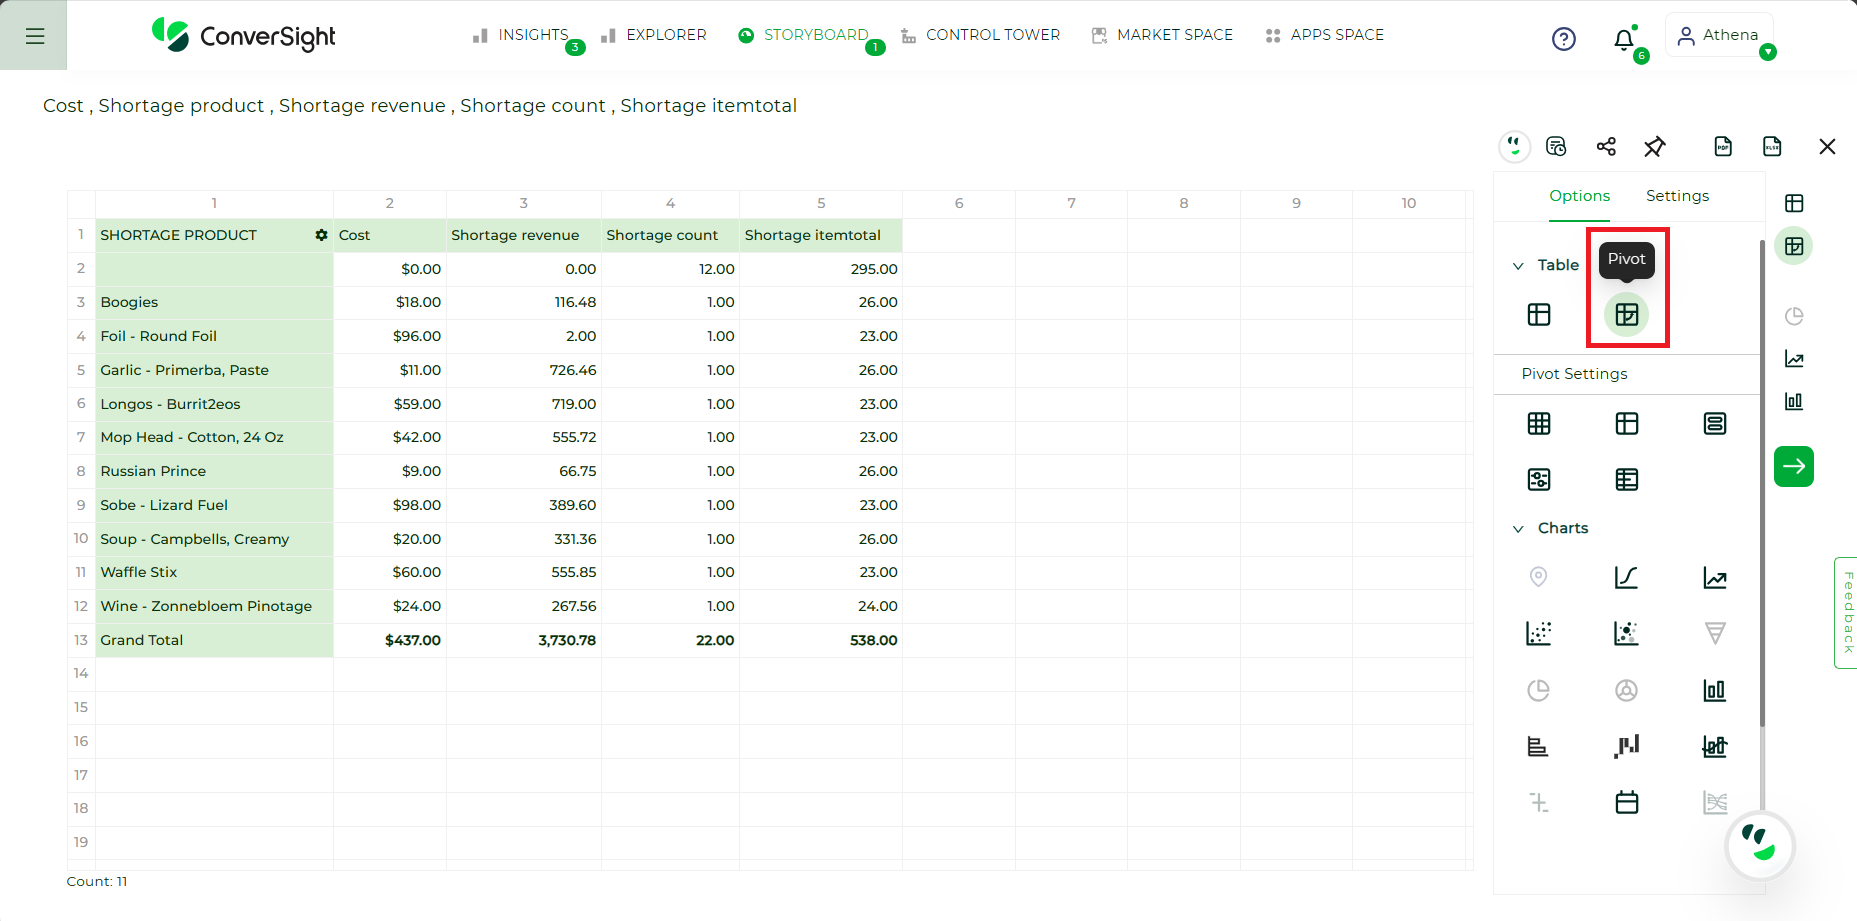
Step 3: Select the Pivot Table option and then navigate to the Fields options within the Pivot Settings.
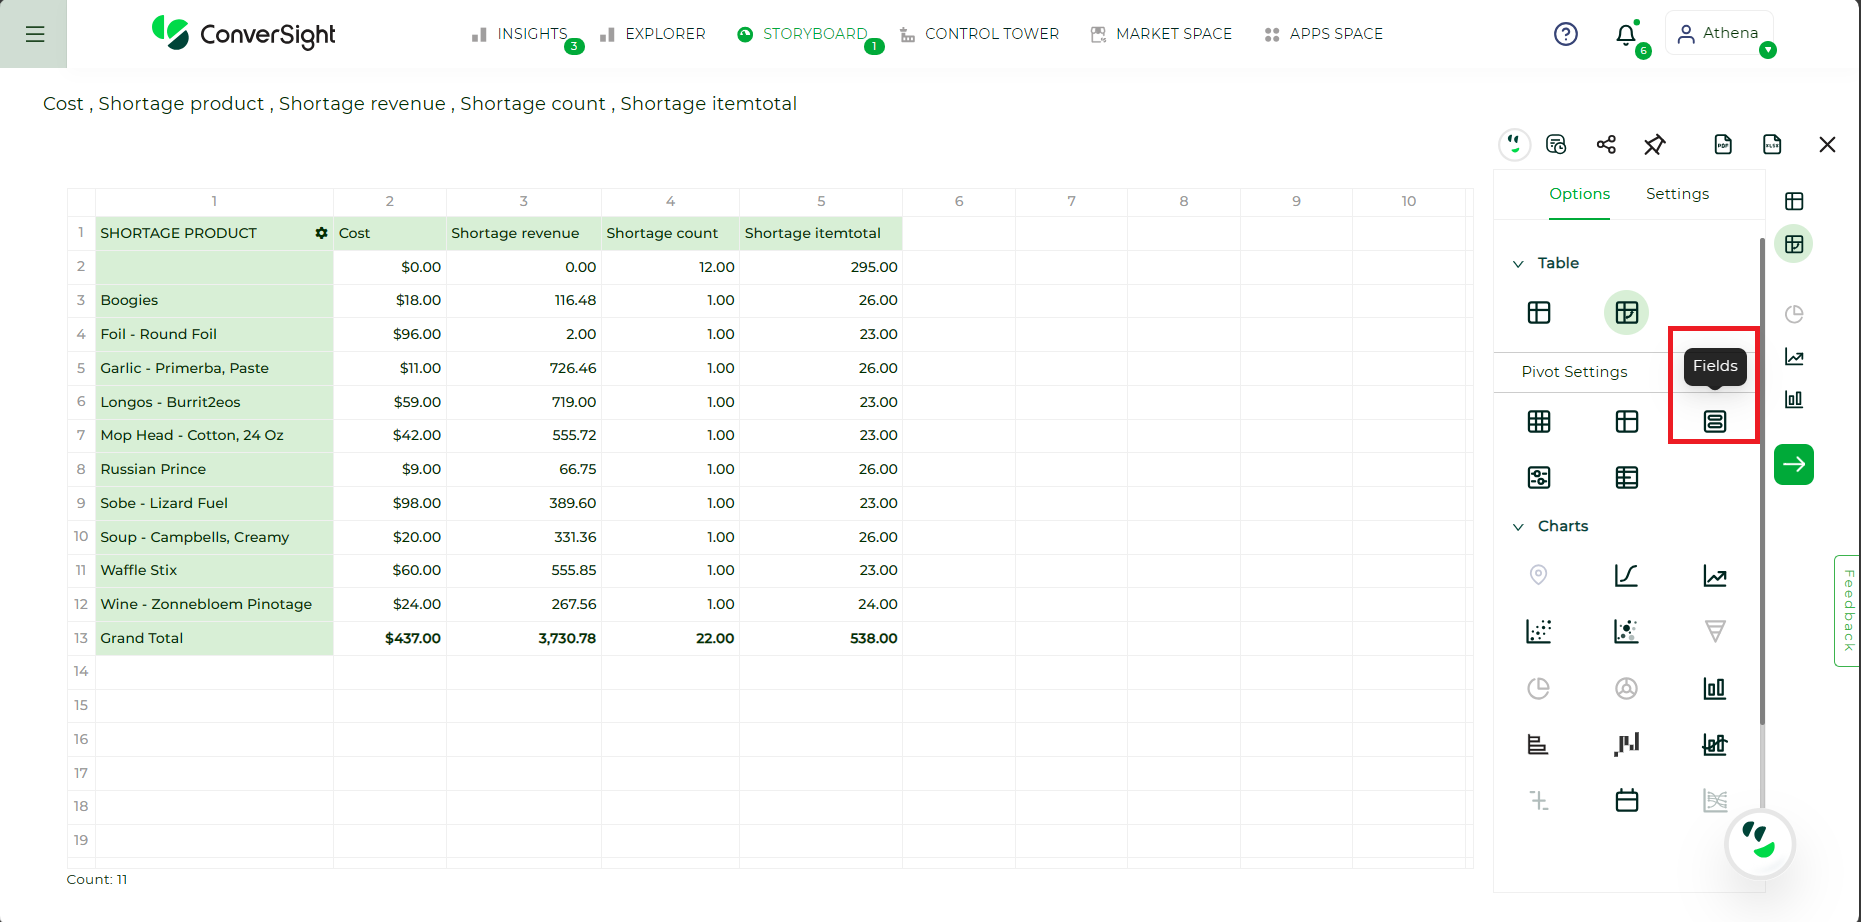
Fields Option#
Step 4: When you select the Fields option, it will open the Fields tab, allowing you to choose Add calculated value.
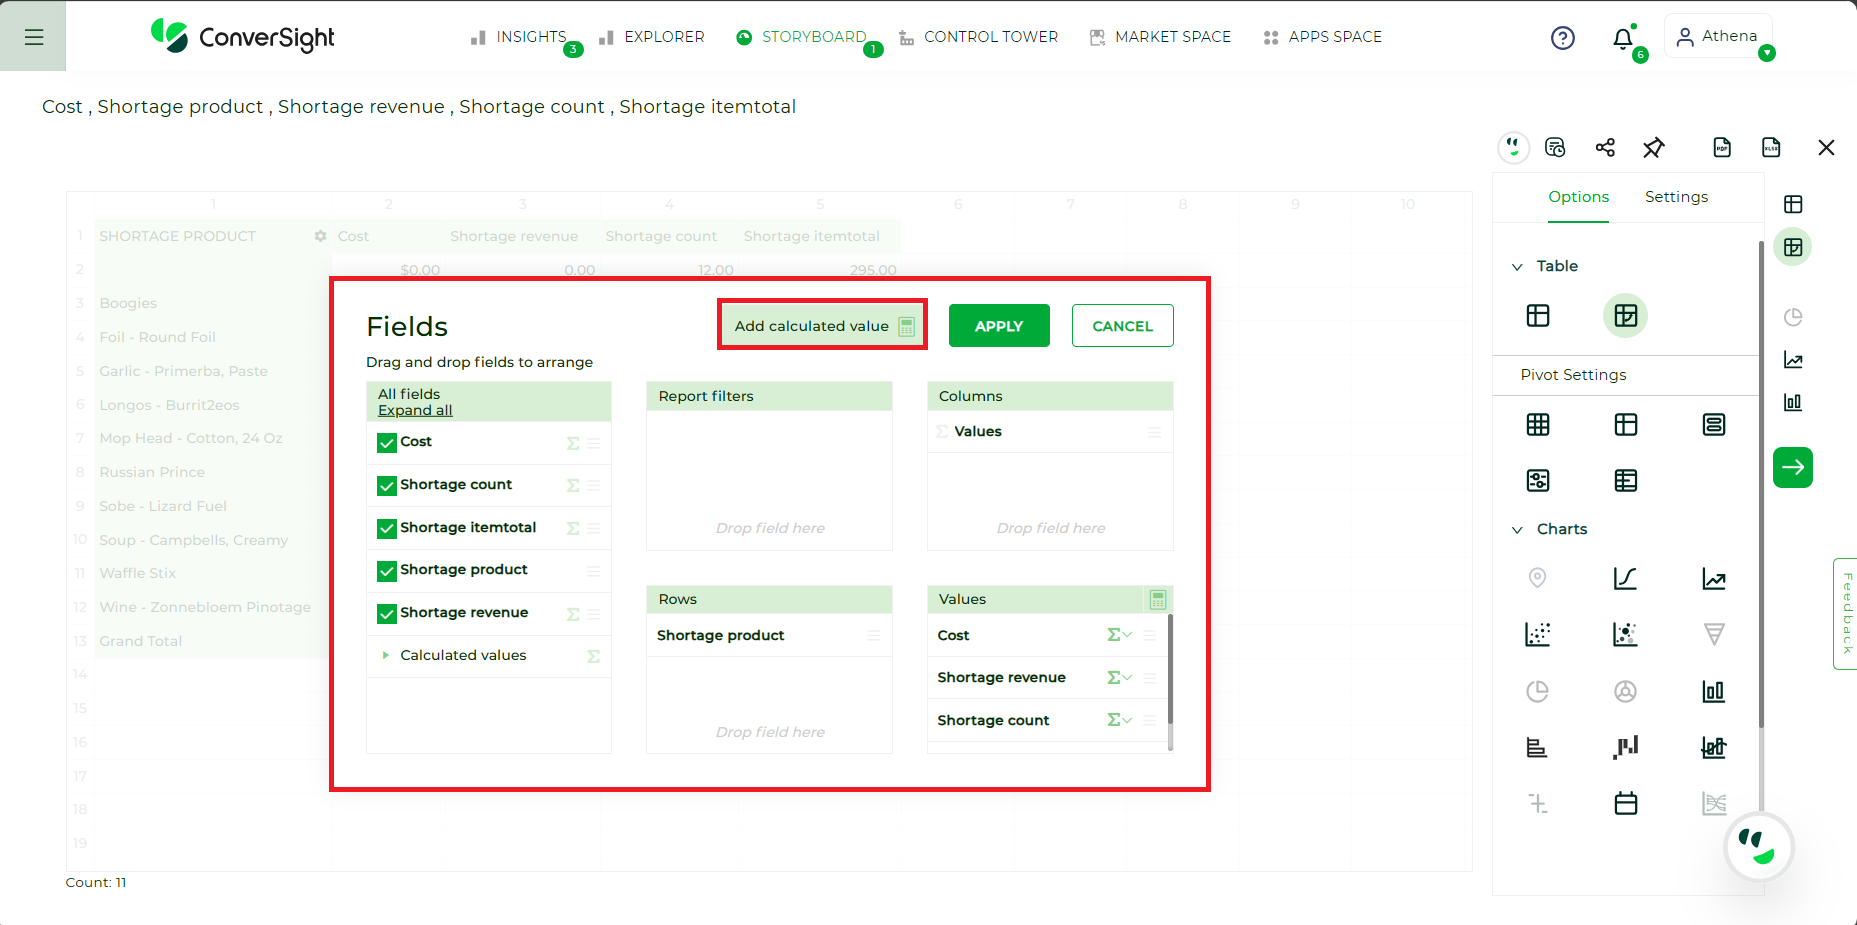
Add Calculated Value#
Step5: In the Calculated value tab, you can assign a name to your Calculated Column. This tab provides a comprehensive list of columns with potential aggregation options, as well as a selection of operators and functions that can be utilized to construct your formula. To create the formula for your Calculated Column, you can easily drag and drop the desired columns into the formula box.
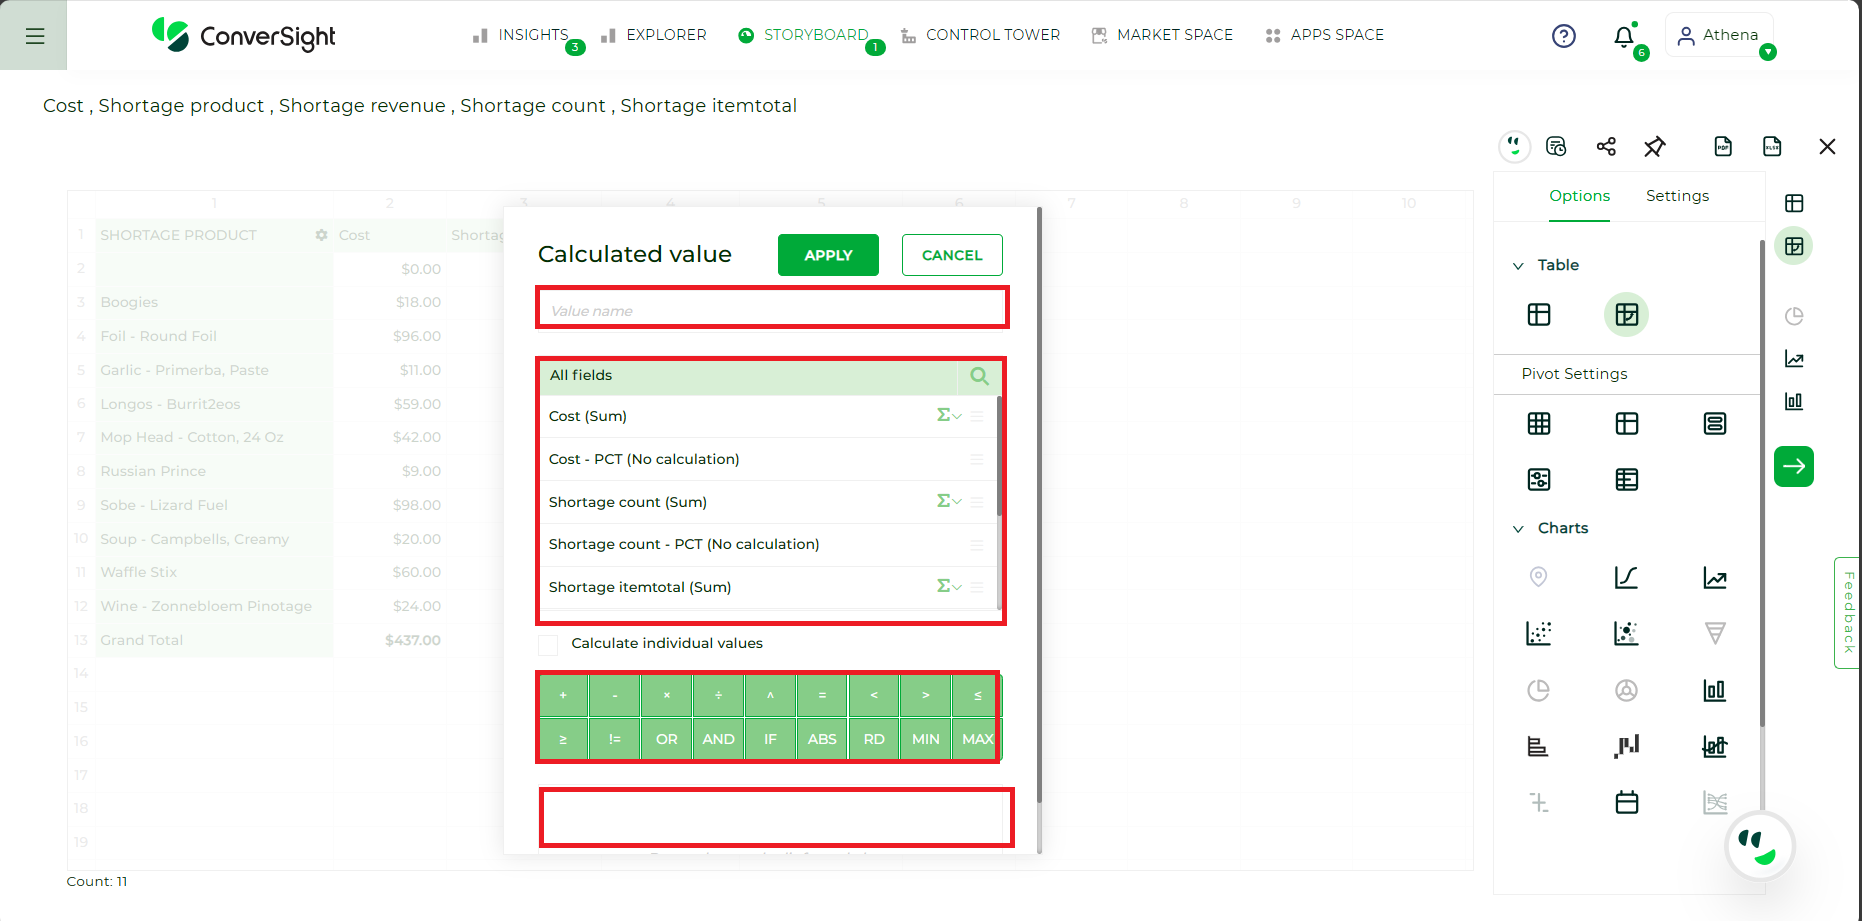
Calculated Value Tab#
Step 6: By clicking the  icon, you can choose the suitable column aggregation for your Calculated Column formulation.
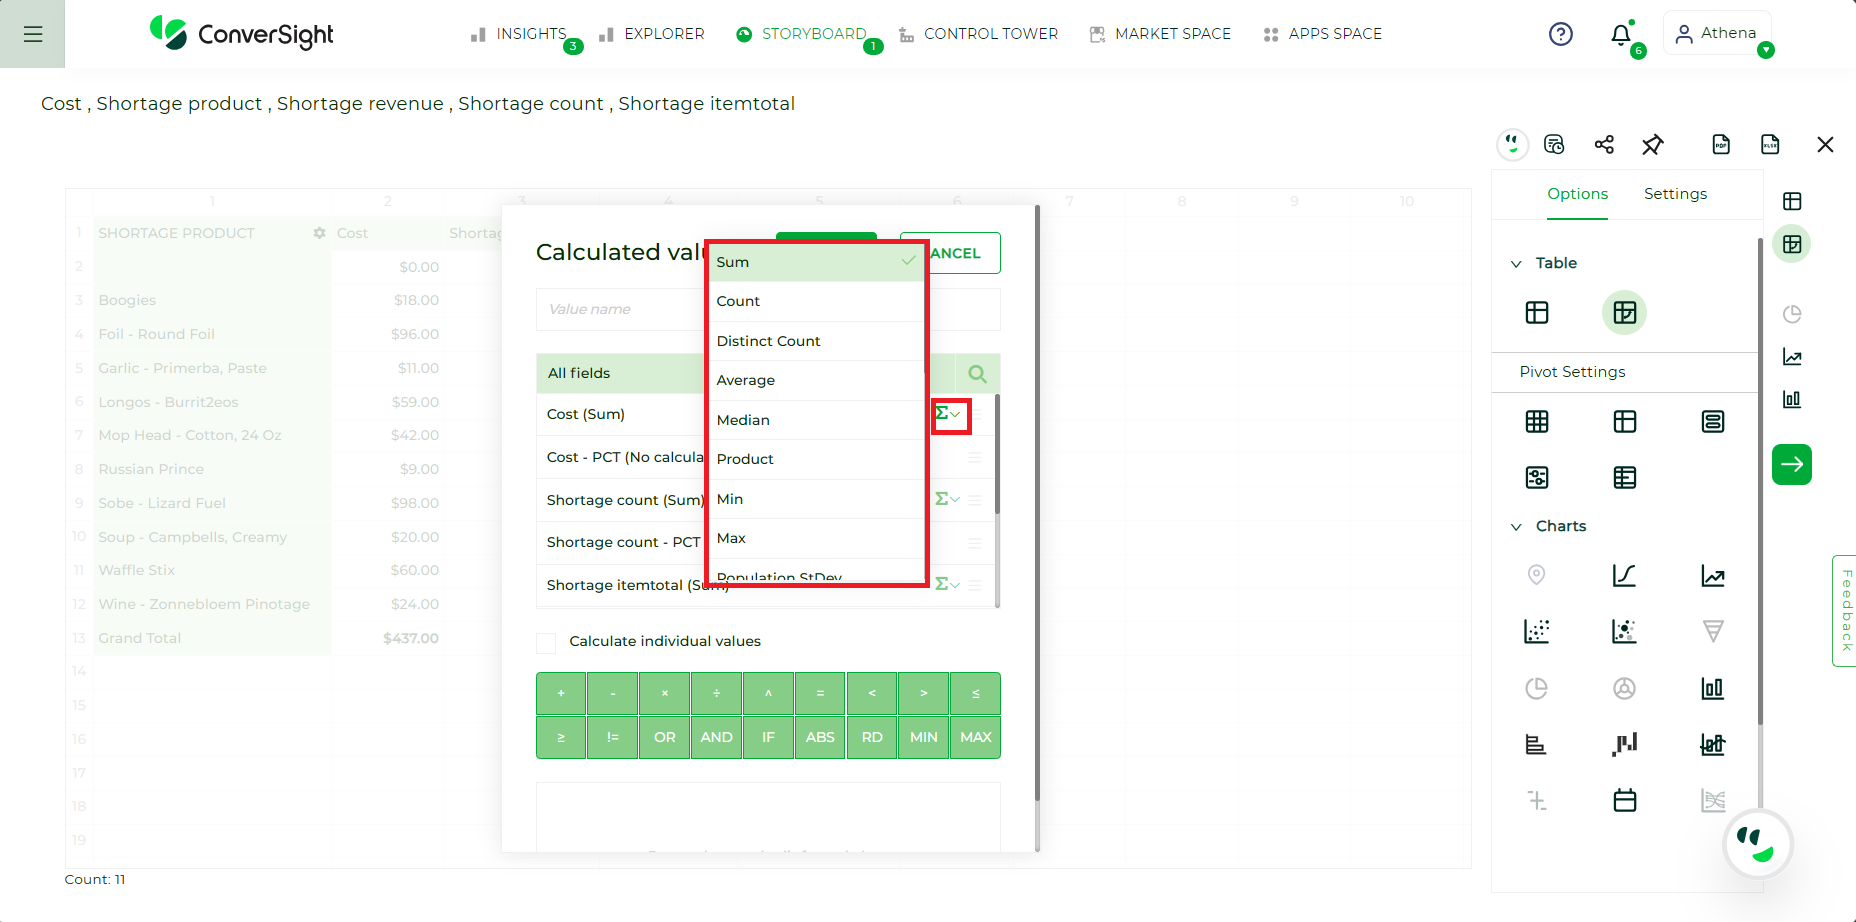
Aggregation Icon#
Both metric and dimensional columns support the following functions.
Function |
Description |
|---|---|
Count |
Total number of items or occurrences within each specified category or intersection of categories. |
Distinct Count |
Number of unique and different items or entities within each specified category or intersection of categories. |
% of Grand Total |
Percentage contribution of each cell’s value to the sum of all values in the entire table. |
% of Column |
Percentage contribution of each cell’s value to the total of its respective column. |
% of Row |
Percentage contribution of each cell’s value to the total of its respective row. |
% of Parent Column Total |
Proportion of a specific cell’s value relative to the sum of all values in the same column. |
% of Parent Row Total |
Percentage contribution of each cell’s value to the total of its parent row. |
Index |
Calculated value indicating the relative position or ranking of a specific item, row or column in the dataset. |
Difference of Column |
Numerical variance between the values in a specific column and a reference point. |
Difference of Row |
Numerical variance between the values in a particular row and a reference point. |
% Difference of Column |
Percentage difference between the values in a specific column and a reference point, typically the previous column. |
% Difference of Row |
Percentage difference between the values in a particular row and a reference point, often the previous row. |
Running Totals of Column |
Cumulative sum of values in each column of a dataset. |
Running Totals of Row |
Cumulative sum of values in each row of a dataset. |
Apart from the functions listed above, additional functions are supported by metric columns.
Function |
Description |
|---|---|
Sum |
Represents the total of values within a specified category or intersection in a pivot table. |
Average |
Calculates the mean value in a pivot table. |
Median |
Provides a measure of central tendency that divides the dataset into two equal halves, with half of the values falling below and half above the median. |
Product |
The Product function can be used to derive a single result by multiplying all the values within a specific column. |
Minimum |
Returns the smallest value of the column in a pivot table. |
Maximum |
Returns the largest value of the column in a pivot table. |
Population Standard Deviation |
Measures the amount of variation of values in a pivot table dataset. |
Sample Standard Deviation |
Estimates the amount of variation of values in a sample within a pivot table. |
Step 7: To create a formula, simply drag and drop your columns with the appropriate aggregation options.
sum("Shortage_revenue") / sum("Shortage_cost_")
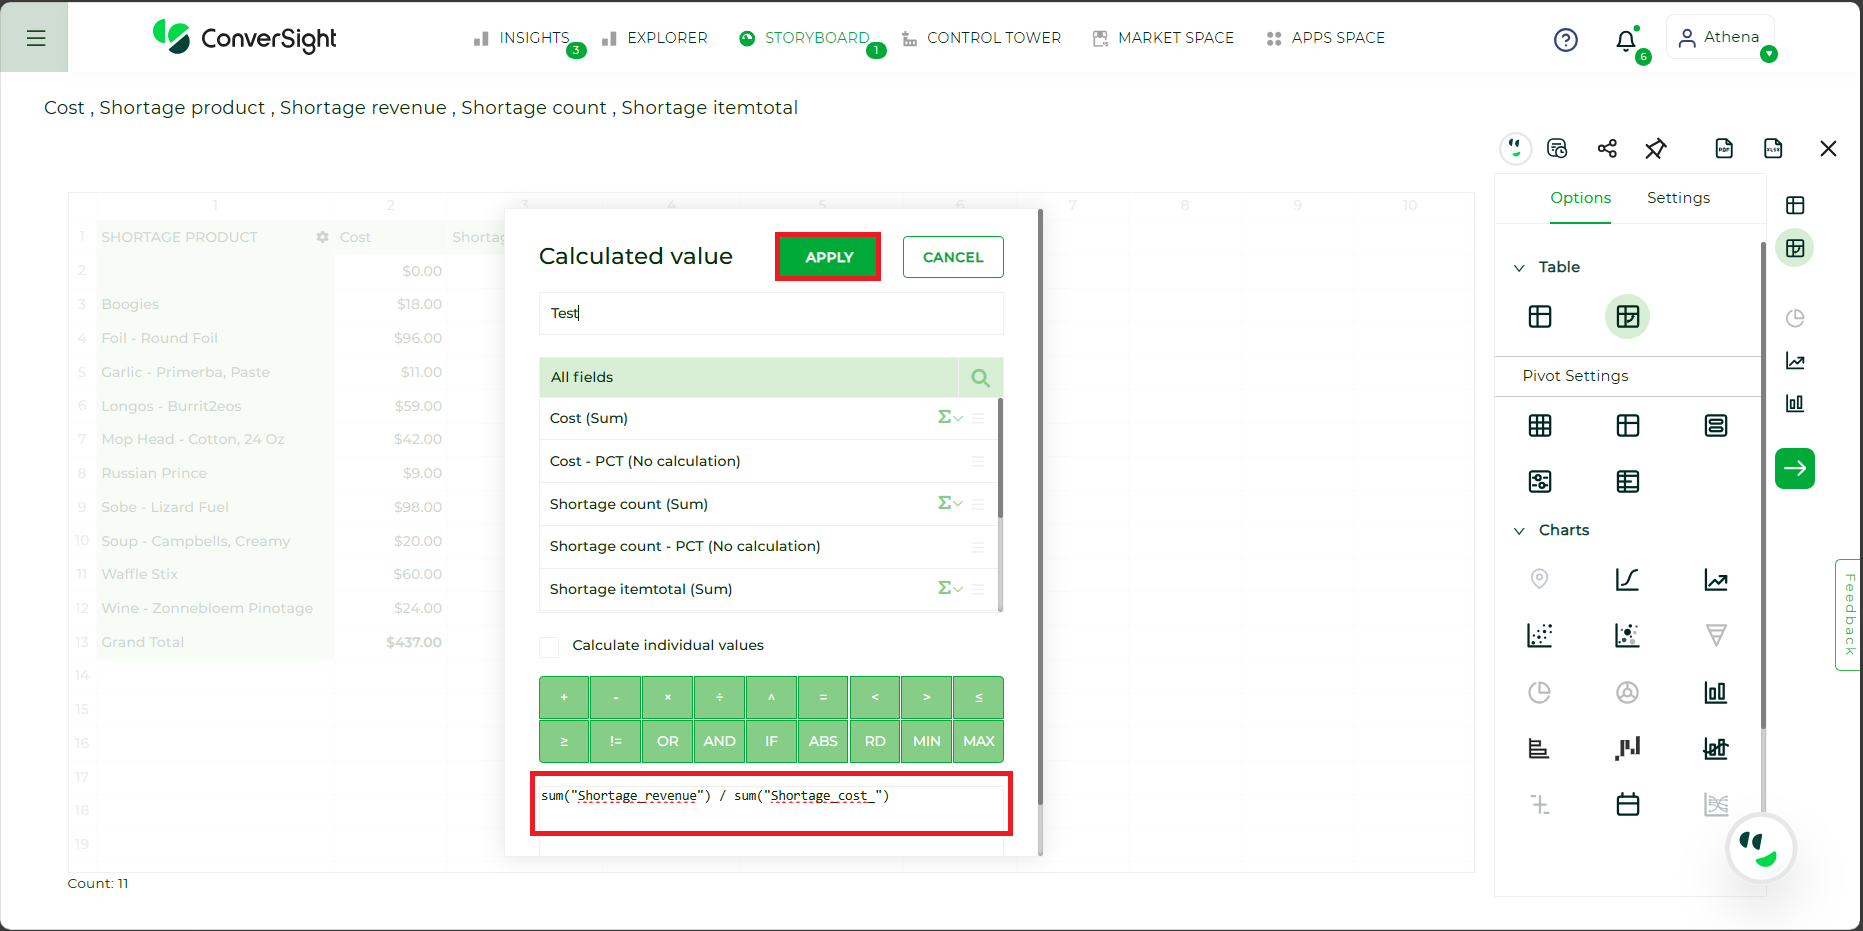
Drag and Drop#
Once your formulation is complete, click on the Apply button.
Step 8: The generated Calculated Column is created and to save your table with the Calculated Column, choose the pin
icon to add it to your Storyboard.
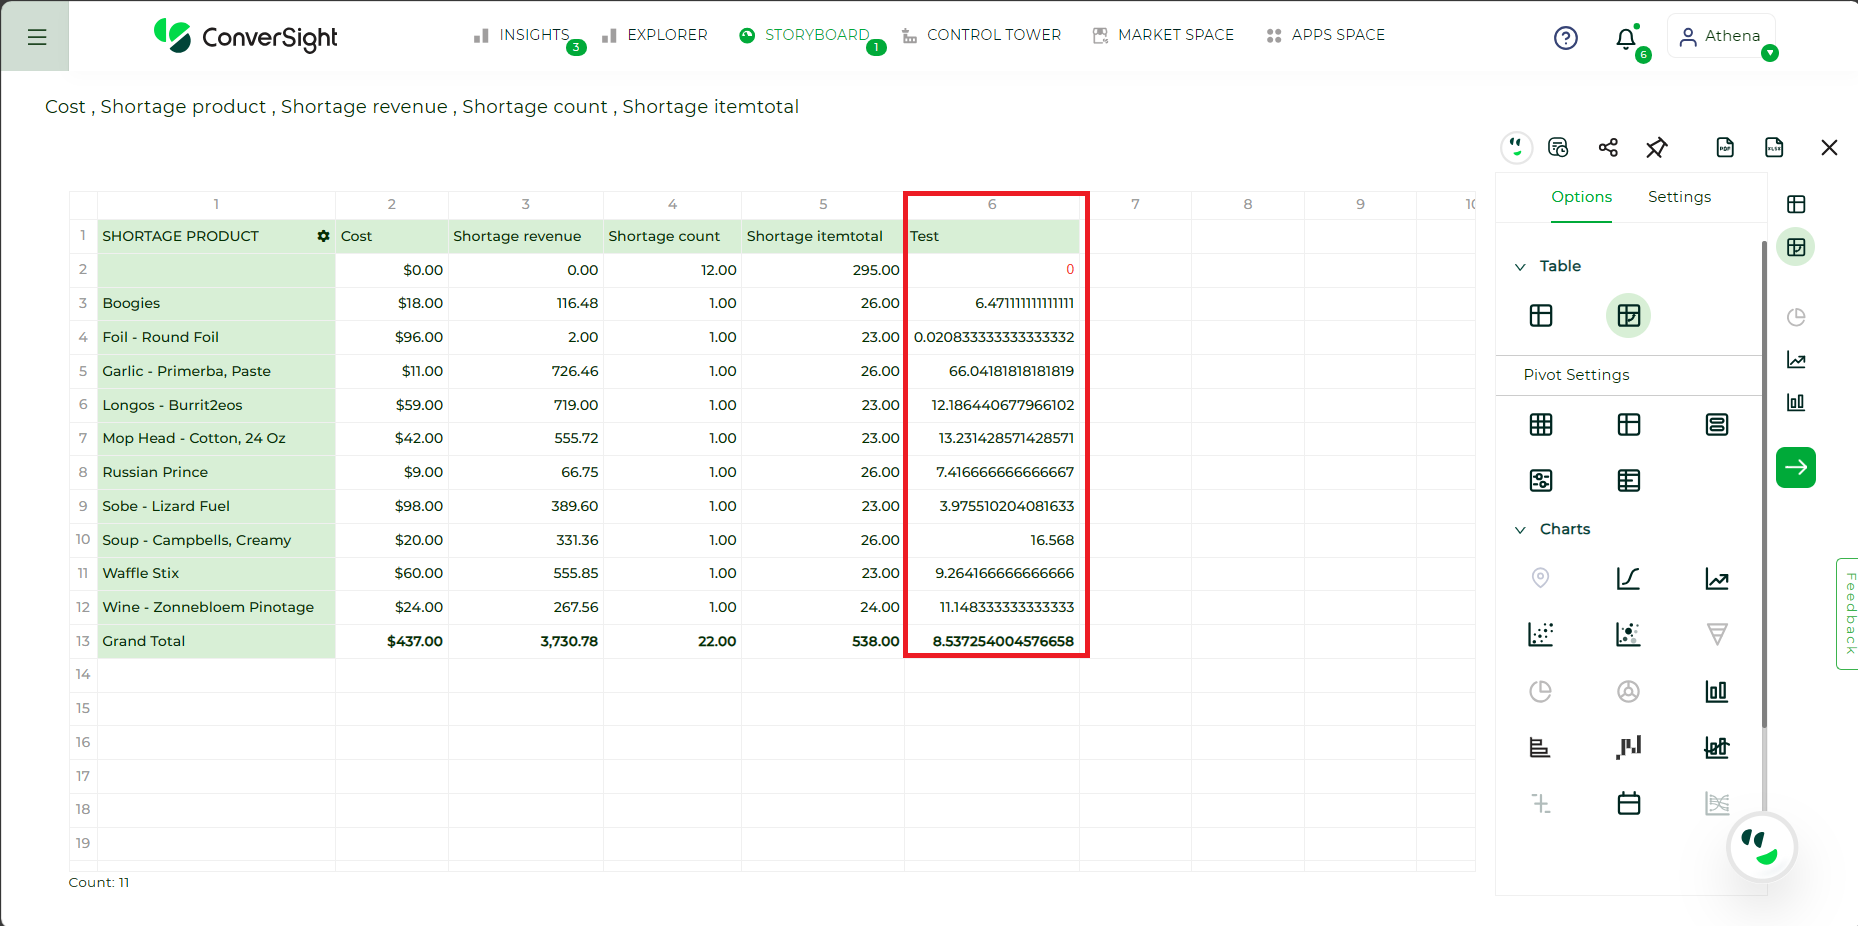
Pin Icon#
Step 9: Click +Create to create new one, else you can select one of the already existing table in the Storyboard and click Add to add it to the Storyboard.
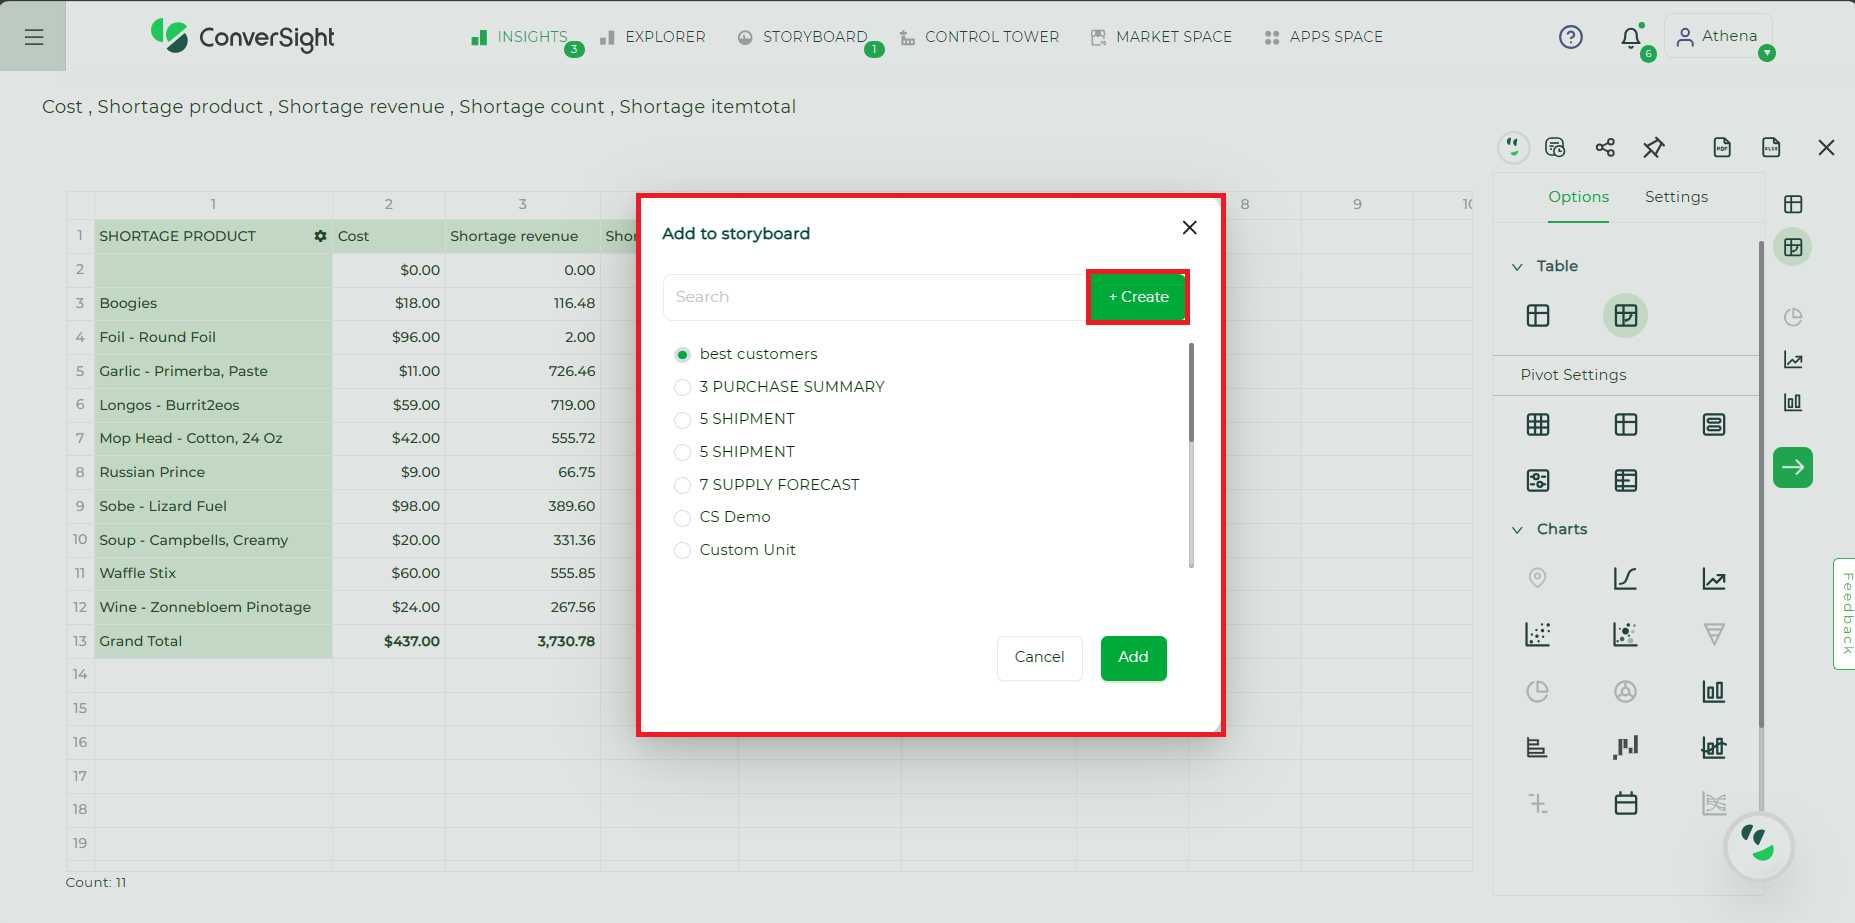
Create New#
Step 10: As we are creating new table click +Create and it pop-ups an Create Storyboard. Name the table and add it to Storyboard by clicking Create & Add for the future reference.
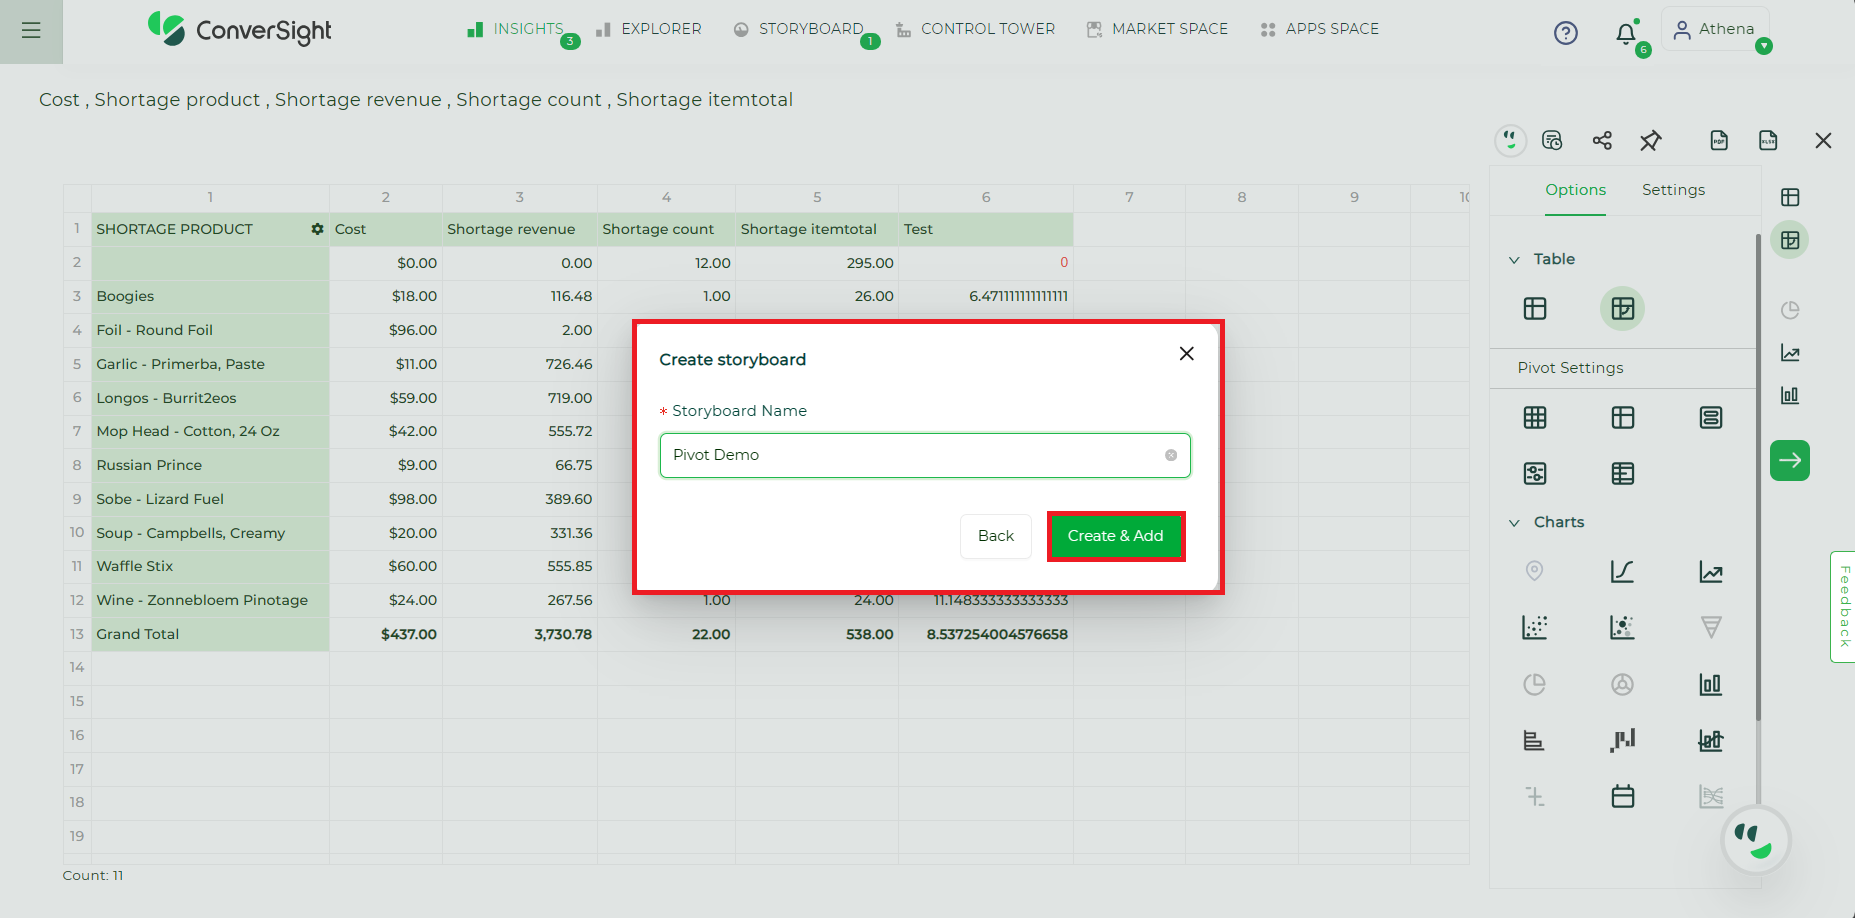
Create Storyboard#
Step 11: As you can see the table is displayed in the Storyboard.
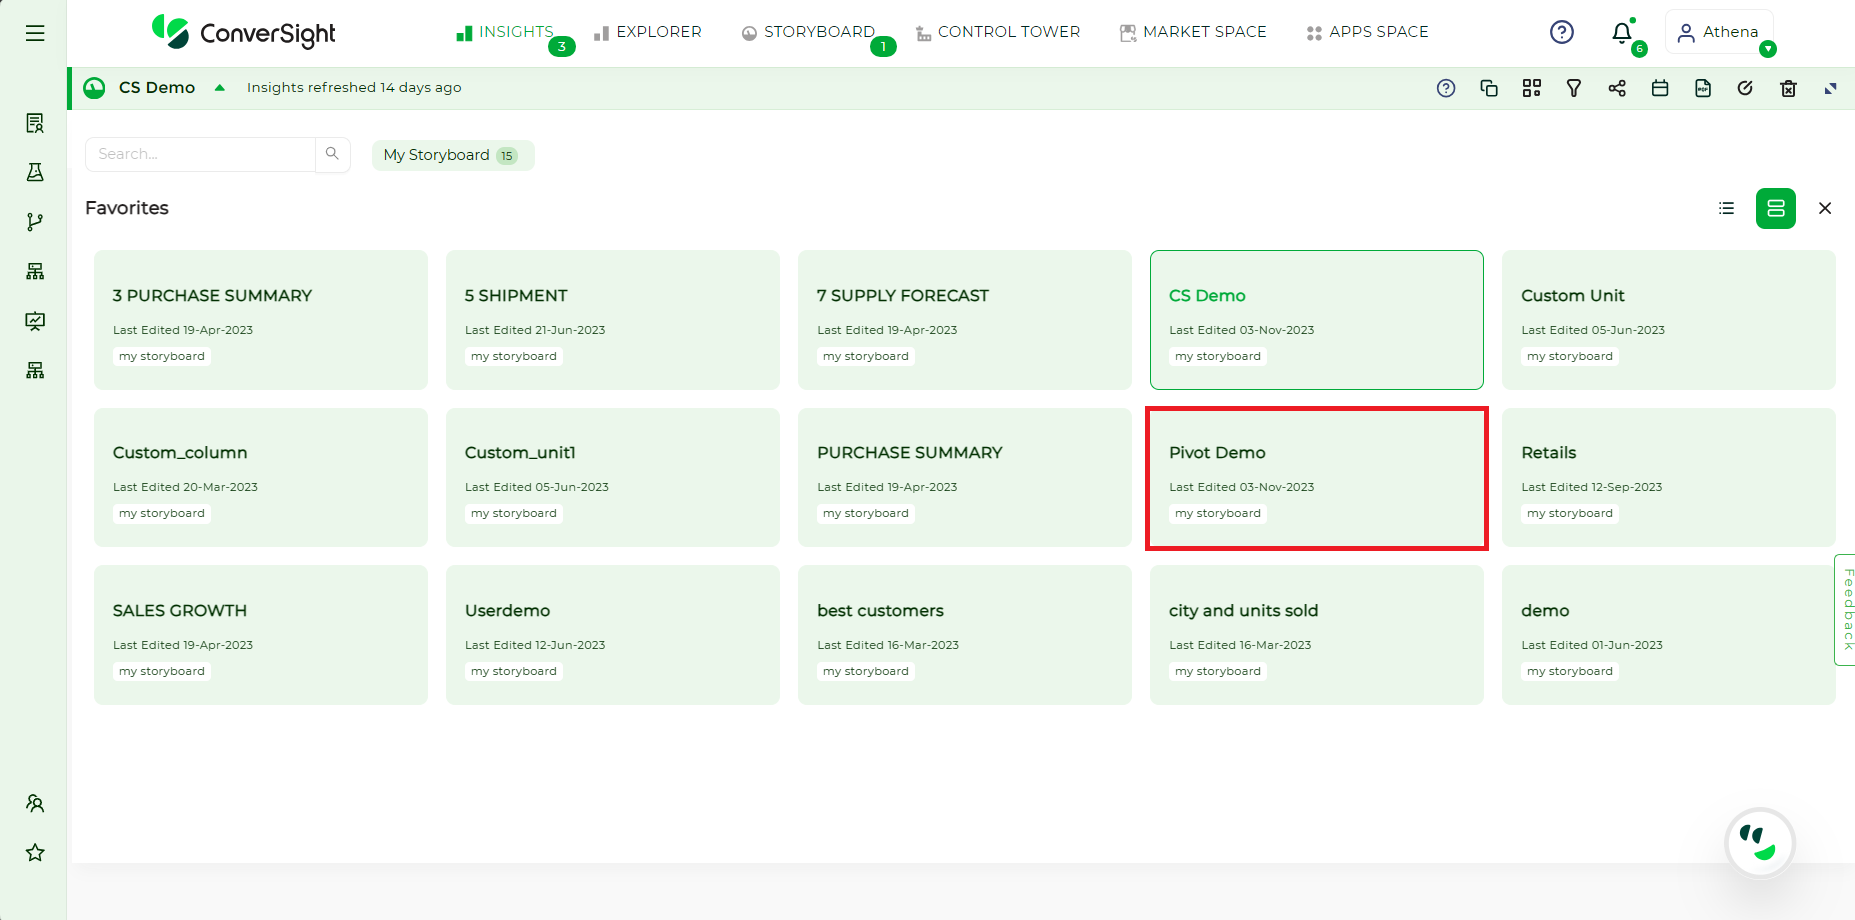
Added to Storyboard#